


Published IHC, IF and IP Pictures for 26910 Rab5-GTP mAb1
Coimmunoprecipitation, SDS–PAGE, and immunoblotting
Cell extracts were incubated with 1.5 μg of anti-V5 (V8012; Sigma-Aldrich) or anti-GFP (G10362; Invitrogen) antibodies and 10 μl of Dynabeads (Invitrogen). Proteins were resolved by SDS–PAGE, transferred onto Hybond-P membranes (Amersham Biosciences, Piscataway, NJ), and probed with appropriate dilutions of the following antibodies: ….. anti-Rab5 GTP (26911; NewEast Biosciences, Malvern, PA), anti-V5 (20-783-70389; GenWay, San Diego, CA), and anti–β-actin (A2228; Sigma-Aldrich). Immunoreactivity was detected using a GE HealthCare Image Quant system.
GTP-loaded Rab5 pull-down assay
Dynabeads were coated with anti–Rab5-GTP mouse monoclonal antibody (26911; NewEast Biosciences). Beads were then incubated with protein extract from mRFP-Rab5–transfected cells for 1 h at 15°C. Precipitated active Rab5 was detected by immunoblotting using anti-DsRed polyclonal antibody (632496; Clontech).
Ratiometric FRET microscopy to detect Rab5 and Rac1 activity
We used pRaichu-Rac1 and pRaichu-Rab5 as FRET probes for Rab5 and Rac1 GTPases, respectively. Raichu-Rac1 consists of YFP, CRIB of PAK1, Rac1, CFP (amino acids 1–237), and the CAAX box of Ki-Ras (Itoh et al., 2002). Raichu-Rab5 consists of Venus, the amino-terminal Rab5-binding domain of EEA1 (amino acid residues 36–218), SECFP, and Rab5a (Kitano et al., 2008). FRET analysis for Rac1 and Rab5 was conducted as described previously (Aoki and Matsuda, 2009). Briefly, control and DRG2-depleted MCF7 cells were transfected with pRaichu-Rac1 or pRaichu-Rab5. Images were captured using the ratiometric FRET module in the FluoView program of the LSM FV1000 confocal microscope (Olympus, Tokyo, Japan). CFP and YFP images were processed by ImageJ and MetaMorph software (Universal Imaging, West Chester, PA). After background subtraction, FRET ratio images were generated using MetaMorph software and visualized in intensity-modulated display mode. In this display mode, eight colors from red to blue are used to represent the FRET ratio (YFP/CFP), with the intensity of each color indicating the mean intensity of YFP and CFP.
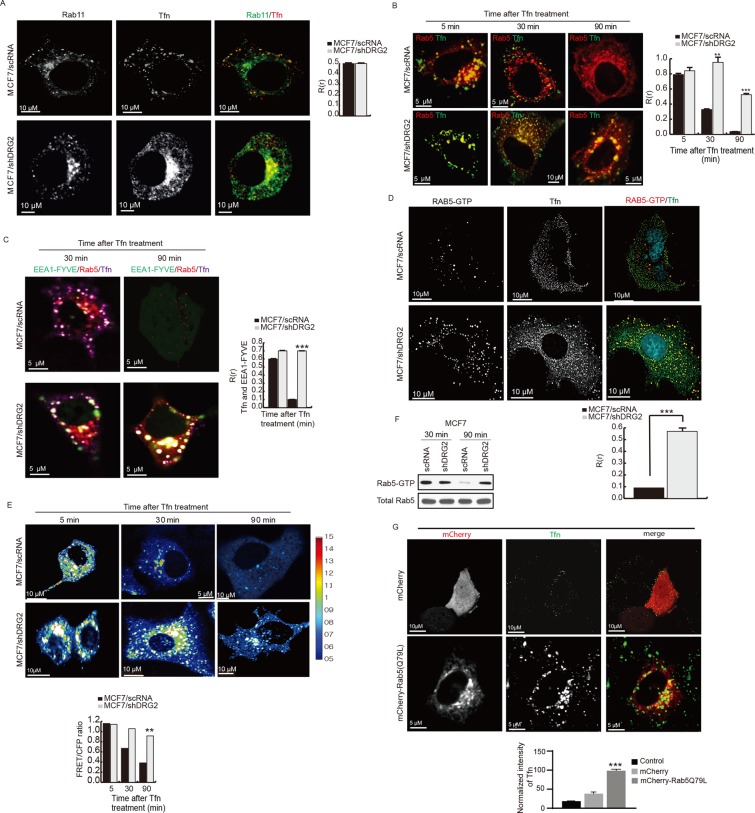
(D) Detection of active GTP-bound Rab5 on Tfn-containing endosomes in DRG2-depleted MCF7 cells. Control and DRG2-depleted MCF7 cells were incubated with Tfn–Alexa 647 for 30 min. Cells were stained with anti–Rab5-GTP antibody. Graph represents Pearson’s R(r). (E) FRET analysis for detection of GTP-bound Rab5 in living cells. FRET images were obtained from control and DRG2-depleted MCF7 cells expressing Raichu-Rab5 and incubated with Tfn for the indicated times. FRET is presented as pseudocolor images. Graph shows FRET/CFP ratio. (F) GTP-loaded Rab5 pull-down assay. GTP-loaded Rab5 was pulled down from lysates of control and DRG2-depleted MCF7 cells expressing mRFP-Rab5 and incubated with Tfn for 30 min. (G) Expression of Rab5 (Q79L) mimics the phenotypes of DRG2-depleted cells. Confocal images of MCF7 cells expressing mCherry or mCherry-Rab5 (Q79L) and incubated with Tfn–Alexa 647 for 30 min. Graph represents the mean fluorescence intensities in arbitrary units. All values are mean ± SD from three experiments, with 10 different cells per group per experiment. **p < 0.01; ***p < 0.001. Scale bar, 10 μm.
Coimmunoprecipitation, SDS–PAGE, and immunoblotting
Cell extracts were incubated with 1.5 μg of anti-V5 (V8012; Sigma-Aldrich) or anti-GFP (G10362; Invitrogen) antibodies and 10 μl of Dynabeads (Invitrogen). Proteins were resolved by SDS–PAGE, transferred onto Hybond-P membranes (Amersham Biosciences, Piscataway, NJ), and probed with appropriate dilutions of the following antibodies: ….. anti-Rab5 GTP (26911; NewEast Biosciences, Malvern, PA), anti-V5 (20-783-70389; GenWay, San Diego, CA), and anti–β-actin (A2228; Sigma-Aldrich). Immunoreactivity was detected using a GE HealthCare Image Quant system.
GTP-loaded Rab5 pull-down assay
Dynabeads were coated with anti–Rab5-GTP mouse monoclonal antibody (26911; NewEast Biosciences). Beads were then incubated with protein extract from mRFP-Rab5–transfected cells for 1 h at 15°C. Precipitated active Rab5 was detected by immunoblotting using anti-DsRed polyclonal antibody (632496; Clontech).
Ratiometric FRET microscopy to detect Rab5 and Rac1 activity
We used pRaichu-Rac1 and pRaichu-Rab5 as FRET probes for Rab5 and Rac1 GTPases, respectively. Raichu-Rac1 consists of YFP, CRIB of PAK1, Rac1, CFP (amino acids 1–237), and the CAAX box of Ki-Ras (Itoh et al., 2002). Raichu-Rab5 consists of Venus, the amino-terminal Rab5-binding domain of EEA1 (amino acid residues 36–218), SECFP, and Rab5a (Kitano et al., 2008). FRET analysis for Rac1 and Rab5 was conducted as described previously (Aoki and Matsuda, 2009). Briefly, control and DRG2-depleted MCF7 cells were transfected with pRaichu-Rac1 or pRaichu-Rab5. Images were captured using the ratiometric FRET module in the FluoView program of the LSM FV1000 confocal microscope (Olympus, Tokyo, Japan). CFP and YFP images were processed by ImageJ and MetaMorph software (Universal Imaging, West Chester, PA). After background subtraction, FRET ratio images were generated using MetaMorph software and visualized in intensity-modulated display mode. In this display mode, eight colors from red to blue are used to represent the FRET ratio (YFP/CFP), with the intensity of each color indicating the mean intensity of YFP and CFP.
(D) Detection of active GTP-bound Rab5 on Tfn-containing endosomes in DRG2-depleted MCF7 cells. Control and DRG2-depleted MCF7 cells were incubated with Tfn–Alexa 647 for 30 min. Cells were stained with anti–Rab5-GTP antibody. Graph represents Pearson’s R(r). (E) FRET analysis for detection of GTP-bound Rab5 in living cells. FRET images were obtained from control and DRG2-depleted MCF7 cells expressing Raichu-Rab5 and incubated with Tfn for the indicated times. FRET is presented as pseudocolor images. Graph shows FRET/CFP ratio. (F) GTP-loaded Rab5 pull-down assay. GTP-loaded Rab5 was pulled down from lysates of control and DRG2-depleted MCF7 cells expressing mRFP-Rab5 and incubated with Tfn for 30 min. (G) Expression of Rab5 (Q79L) mimics the phenotypes of DRG2-depleted cells. Confocal images of MCF7 cells expressing mCherry or mCherry-Rab5 (Q79L) and incubated with Tfn–Alexa 647 for 30 min. Graph represents the mean fluorescence intensities in arbitrary units. All values are mean ± SD from three experiments, with 10 different cells per group per experiment. **p < 0.01; ***p < 0.001. Scale bar, 10 μm.
Immunohistochemistry analyses
Antibodies against TUFT1 (dilution 1:100, Abcam, UK), Rab5-GTP (dilution 1:100, NewEast Bioscience, USA), and Rac1-GTP (dilution 1:800, NewEast Bioscience, USA), were used for the immunohistochemical (IHC) analyses of the TNBC samples. The levels of TUFT1, Rab5-GTP, and RAC1-GTP were semi-quantitatively evaluated as described previously [7, 8]. The analysis was performed by two independent pathologists.
Rab5-GTP and Rac1-GTP pull-down assays
Cells were split in buffer containing 25 mM HEPES, 1% NP40, 10% glycerin, 5 mM MgCl2, 1 mM DTT, 100 mM NaCl, and protease inhibitors. The pyrolysate was incubated on ice for 5 min and then centrifuged for 1 min at 10,000×g. This post-nuclear supernatant was used for a pulldown analysis with 30 μg of GST-RBD pre-coated GSH beads. The beads and supernatant were incubated at 4 °C for 15 min. Then, the beads were washed with a buffer containing 0.01% NP40, boiled with SDS-PAGE buffer, and separated by SDS-PAGE. The proteins attached to the beads were analyzed by western blotting as described above. NSC23766 (Tocris Bioscience) was used to inhibit Rac1 activation.
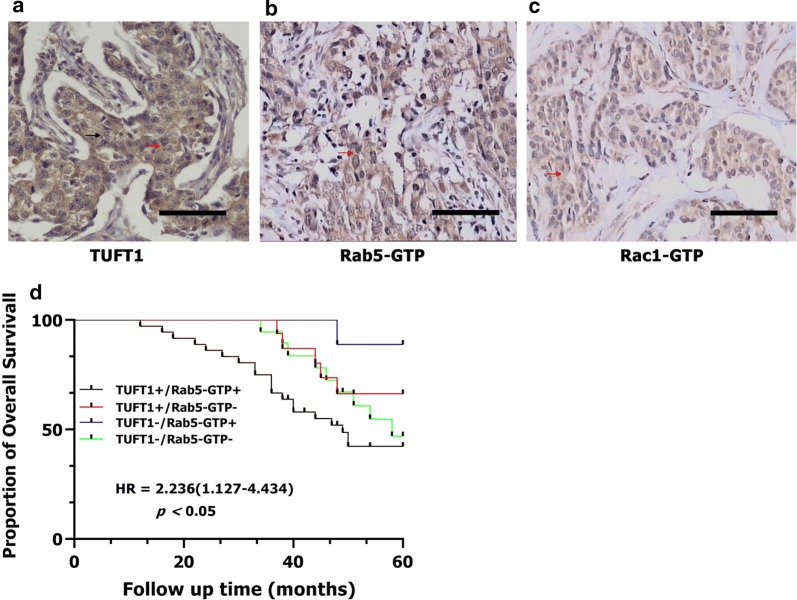
The expression of TUFT1, Rab5-GTP and Rac1-GTP in 80 TNBC patients who had received anthracycline/taxanes chemotherapy after surgery. a–c The positive expression of TUFT1, Rab5-GTP and Rac1-GTP in serial sections. Red arrows indicated cytoplasmic staining; black arrows indicated membrane staining. d Kaplan–Meier survival curves showing survival in 80 patients who received chemotherapy blotted in relation to TUFT1 and Rab5-GTP expression. Survival curves showing the poor overall survival in patients with tumors co-expressing TUFT1 and Rab5-GTP that received chemotherapy
Immunohistochemistry analyses
Antibodies against TUFT1 (dilution 1:100, Abcam, UK), Rab5-GTP (dilution 1:100, NewEast Bioscience, USA), and Rac1-GTP (dilution 1:800, NewEast Bioscience, USA), were used for the immunohistochemical (IHC) analyses of the TNBC samples. The levels of TUFT1, Rab5-GTP, and RAC1-GTP were semi-quantitatively evaluated as described previously [7, 8]. The analysis was performed by two independent pathologists.
Rab5-GTP and Rac1-GTP pull-down assays
Cells were split in buffer containing 25 mM HEPES, 1% NP40, 10% glycerin, 5 mM MgCl2, 1 mM DTT, 100 mM NaCl, and protease inhibitors. The pyrolysate was incubated on ice for 5 min and then centrifuged for 1 min at 10,000×g. This post-nuclear supernatant was used for a pulldown analysis with 30 μg of GST-RBD pre-coated GSH beads. The beads and supernatant were incubated at 4 °C for 15 min. Then, the beads were washed with a buffer containing 0.01% NP40, boiled with SDS-PAGE buffer, and separated by SDS-PAGE. The proteins attached to the beads were analyzed by western blotting as described above. NSC23766 (Tocris Bioscience) was used to inhibit Rac1 activation.
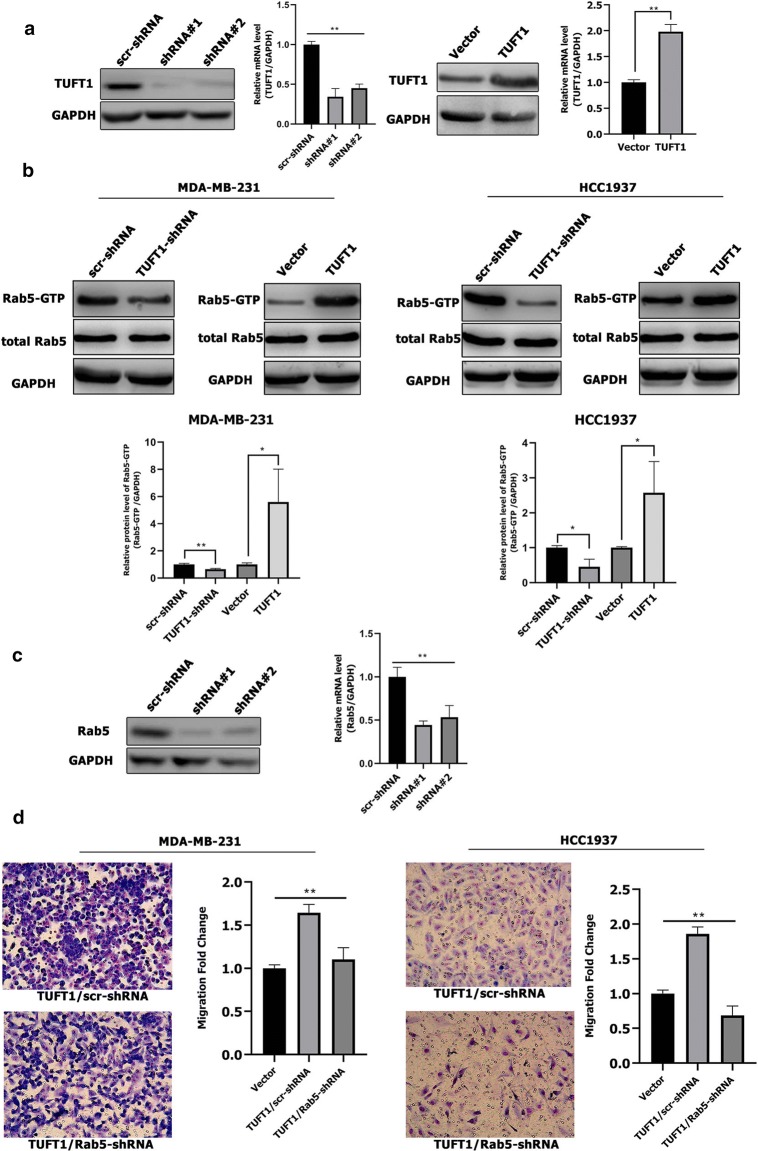
TUFT1 can regulate the Rab5 activation. a TUFT1 protein and mRNA expression levels were examined by western blotting and qPCR in MDA-MB-231 cells after infection with lentivirus containing TUFT1-shRNA or pLNCX2-TUFT1. b TUFT1 expression was downregulated by TUFT1-shRNA and upregulated by PLNCX2-TUFT1 in MDA-MB-231 and HCC1937 cells. Rab5-GTP expression was examined by western blotting (n = 3). c Rab5 protein and mRNA expression levels were examined by western blotting and qPCR in MDA-MB-231 cells after infection with lentivirus containing Rab5-shRNA or scr-shRNA. d Rab5-shRNA or scr-shRNA were transfected into TUFT1-overexpressing MDA-MB-231 and HCC1937 cells. Cell migration was monitored by transwell assay (n = 3). Results are presented as mean ± SD. The statistical significance was assessed by student’s t test; *p < 0.05, **p < 0.01
Immunohistochemistry analyses
Antibodies against TUFT1 (dilution 1:100, Abcam, UK), Rab5-GTP (dilution 1:100, NewEast Bioscience, USA), and Rac1-GTP (dilution 1:800, NewEast Bioscience, USA), were used for the immunohistochemical (IHC) analyses of the TNBC samples. The levels of TUFT1, Rab5-GTP, and RAC1-GTP were semi-quantitatively evaluated as described previously [7, 8]. The analysis was performed by two independent pathologists.
Rab5-GTP and Rac1-GTP pull-down assays
Cells were split in buffer containing 25 mM HEPES, 1% NP40, 10% glycerin, 5 mM MgCl2, 1 mM DTT, 100 mM NaCl, and protease inhibitors. The pyrolysate was incubated on ice for 5 min and then centrifuged for 1 min at 10,000×g. This post-nuclear supernatant was used for a pulldown analysis with 30 μg of GST-RBD pre-coated GSH beads. The beads and supernatant were incubated at 4 °C for 15 min. Then, the beads were washed with a buffer containing 0.01% NP40, boiled with SDS-PAGE buffer, and separated by SDS-PAGE. The proteins attached to the beads were analyzed by western blotting as described above. NSC23766 (Tocris Bioscience) was used to inhibit Rac1 activation.
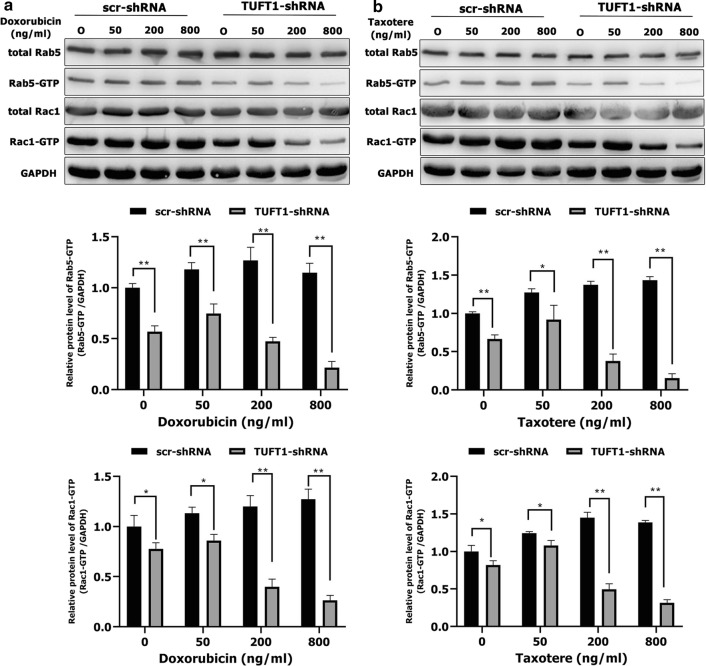
TUFT1 promotes TNBC cell resistance to chemotherapy by upregulating the Rab5/Rac1 pathway. a, b MDA-MB-231 cells were transfected with TUFT1-shRNA or scr-shRNA following treatment with various doses of doxorubicin and Taxotere for 24 h. Levels of Rab5, Rab5-GTP, Rac1 and Rac1-GTP were examined by western blotting in MDA-MB-231 cells (n = 3). Results are presented as mean ± SD. The statistical significance was assessed by Student’s t-test; **p < 0.01
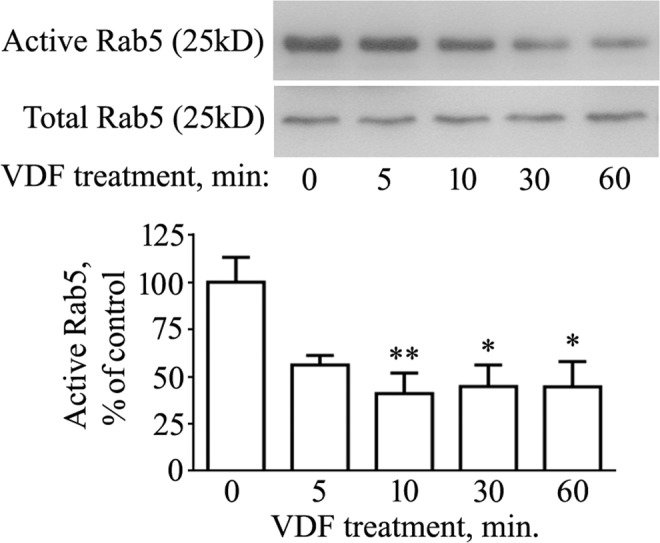
Rab5 activity
N2a cells were grown overnight on 10 cm culture dishes and then incubated with 100 μM vardenafil (or with the same volume of DMSO) for the indicated times. At the end of treatments, Rab5 activity was analyzed with the Rab5 Activation Assay Kit (NewEast Biosciences, USA), according to the manufacturer’s protocol. Briefly, an anti-active Rab5 mouse monoclonal antibody was used to immunoprecipitate the GTP-bound form of Rab5 in the cell extract. Immunoprecipitated Rab5 was then detected by immunoblot analysis using a rabbit anti-Rab5 polyclonal antibody.
The cGMP enhancer vardenafil reduces active Rab5 levels. N2a cells were treated with 100 μM vardenafil (VDF) for different times (5, 10, 30, 60 min). Control samples (0 min) received the same volume of vehicle (DMSO) for 60 min. At the end of treatments, cells were processed for total protein extraction followed by Rab5 activity assay, as described in the Methods section. The image displays cropped blots. Graphed data show mean ± SEM for four independent experiments (*P < 0.05; **P < 0.005 vs the vehicle-treated group).
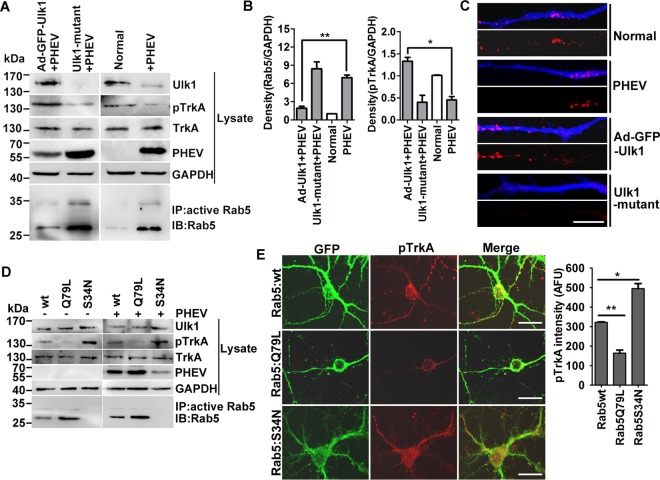
Rab5 GTPase activation assays.
For Rab5 GTPase activation assays, the cells were stimulated with PHEV as desired, and the Rab5 GTP level was measured 24 h later with a Rab5 activation assay kit (NewEast Biosciences, Malvern, PA) according to the manufacturer’s instructions. Briefly, the cells were washed twice with ice-cold PBS and lysed in an ice-cold 1× assay/lysis buffer for 20 min on ice. The lysates were transferred to appropriately sized tubes and cleared at 12,000 × g for 10 min at 4°C. The supernatants were then collected to a microcentrifuge tube, and anti-active Rab5 MAb (1:1,000) and 20 μl of resuspended bead slurry were added. The tubes were incubated at 4°C for 1 h with gentle agitation, followed by aspiration and discarding of the supernatant by centrifugation for 1 min at 5,000 × g. We then resuspended the bead pellet in reducing SDS-PAGE sample buffer, boiled it for 5 min, and then processed it for SDS-PAGE and immunoblotting detection.
Rab5 GTPase activation blocks Ulk1-mediated NGF/TrkA endocytosis. (A) Ad-GFP-Ulk1-overexpressing or Ulk1 mutant cortical neurons were infected with PHEV for 24 h, and then the cell lysates were subjected to Rab5 activity assays and Western blotting using the indicated antibodies. Immunoprecipitation was performed with the anti-active Rab5 monoclonal antibody (1:500). Immunoblotting was performed with an anti-Rab5 polyclonal antibody (1:1,000). (B) Densitometric analysis of blots in panel A was performed; Rab5 intensities were normalized against GAPDH, and pTrkA intensities were normalized against total TrkA. (C) Differential treatments of the cortical neurons as described for panel A were cultured with standard culture medium containing 10 nM Cy3-NGF (red) for 30 min and then fixed and stained with MAP2 (blue). Representative images were acquired using a confocal microscope. Bars, 20 μm. (D) Cortical neurons were transfected with plasmids encoding Rab5:wt, Rab5:Q79L, or Rab5:S34N at 4 DIV. After 24 h of expression, neurons were infected with PHEV for 24 h and were then harvested for Western blot and Rab5 activity assays using the indicated antibodies. (E) Representative images obtained after GFP-Rab5:wt-, Rab5:Q79L-, or Rab5:S34N-expressing neurons were fixed and stained for pTrkA (red). Bar, 20 μm. Quantification analysis revealed that the pTrkA trafficking was markedly suppressed in the Rab5:Q79L-expressing neurons. The y axis represents the average pTrkA intensity per 5 mm of dendrite, and the dendritic field is represented as the sum of the lengths of all the dendrites on one neuron. *, P < 0.05; **, P < 0.01 (Student’s t test).
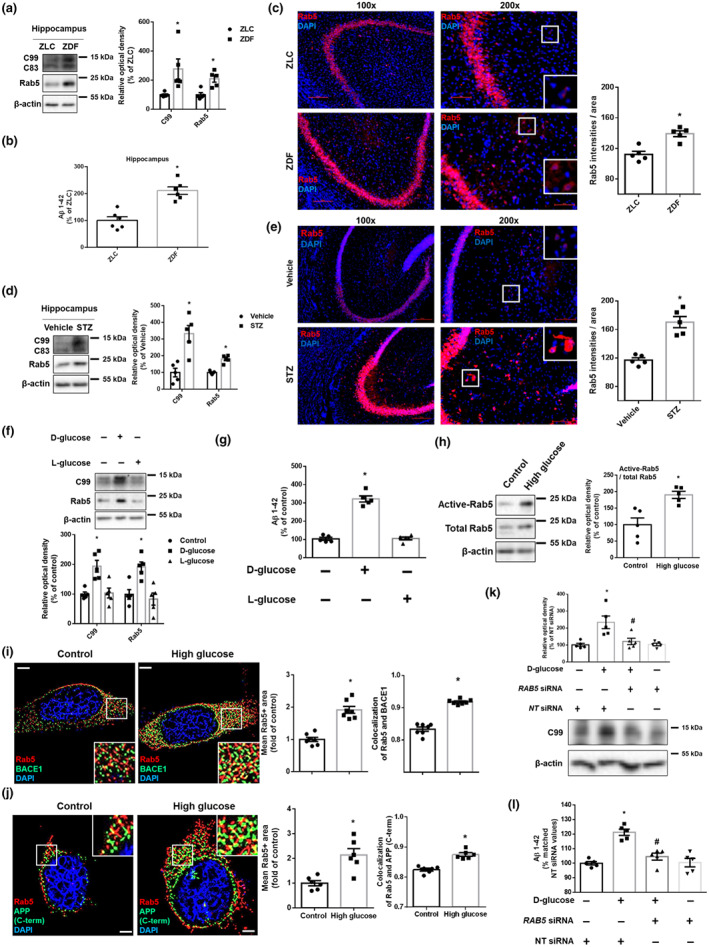
2.14. GTP‐Rab5 activation assay
Measurement of Rab5 activation was performed by using Rab5 activation assay kit (Neweast Bioscience, #83701). All procedures were done in accordance with the manufacturer’s instructions. Briefly, cells were incubated with the provided lysis buffer containing anti‐active Rab5 monoclonal antibody (NewEast Biosciences, #26911, RRID:AB_2617182). Then, by using protein A/G agarose, the bound active Rab5 was pulled down. The precipitated active Rab5 was detected by western blot using Rab5‐specific polyclonal antibody. The ratio of expression levels of active Rab5 and total Rab5 was analysed.
(h) The cells were treated with high glucose (25 mM) for 24 h. Active Rab5 (GTP‐bound Rab5) was immunoprecipitated with Rab5‐specific antibody (upper panels). Expression of Rab5 and β‐actin in total lysate is shown in the middle and lower panels. n = 5 from independent experiments.
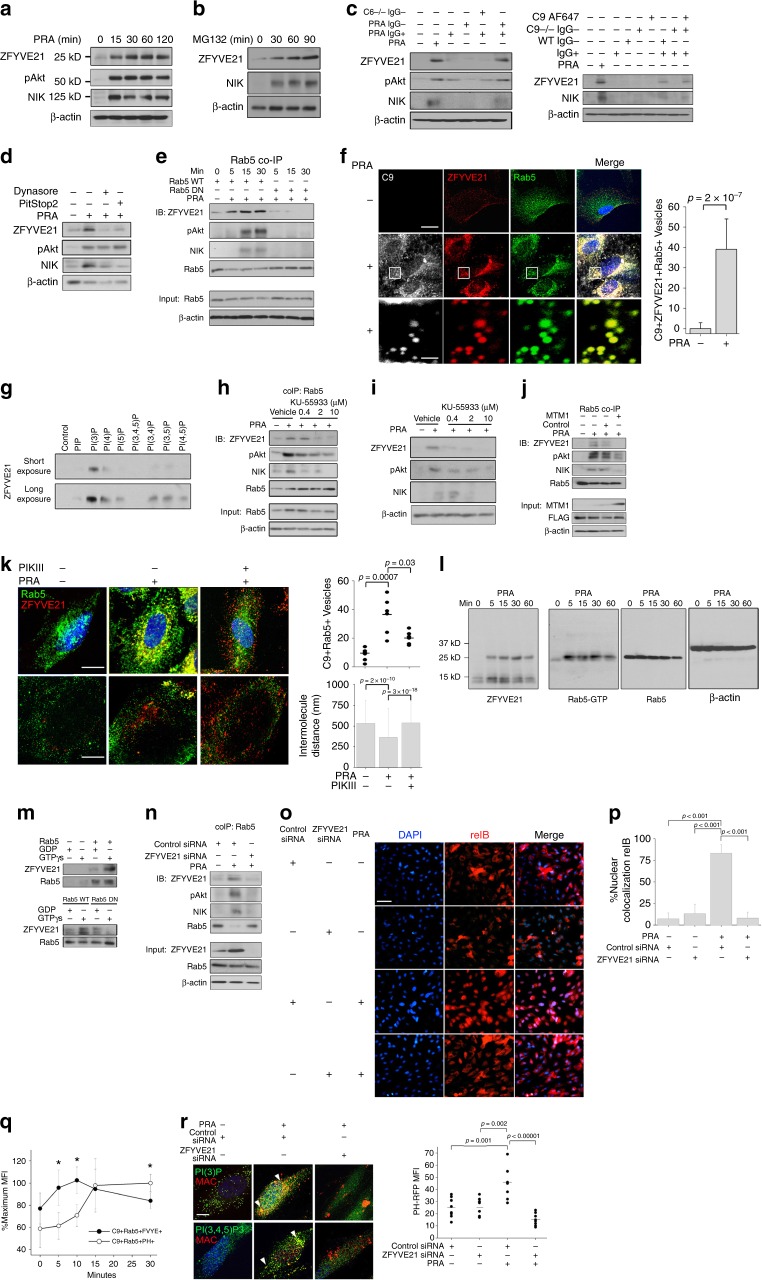
PIP-coated beads were purchased commercially (Echelon Biosciences) and incubated with 1 μg ZFYVE21 protein (Origene) as per the manufacturer’s recommendations. To determine ZFYVE21 binding to active Rab5, 20 μL protein A/G beads (ThermoFisher) were incubated with 10 μL Rab5 antibody at 4 °C overnight. Rab5 protein (1 μg, abcam) or protein lysates (10 μg) were incubated with antibody-conjugated protein A/G beads 4 °C overnight. Beads were washed and incubated with non-hydrolyzable GTPγS (100 μM) or GDP (100 μM, Sigma) for 30 min at room temperature prior to addition of ZFYVE21 (1 μg) for 30 min at room temperature40. To determine ZFYVE21 binding to SMURF2, 20 μL protein A/G beads (ThermoFisher) were incubated with 10 μL ZFYVE21 antibody (Atlas) at 4 °C overnight. ZFYVE21 (1 μg, Origene) protein was incubated with antibody-conjugated protein A/G beads 4 °C overnight. Beads were washed and incubated with SMURF2 (1 μg, Novus) for 30 min at room temperature. All incubations above were performed at a volume of 32 μL using RIPA buffer (Cell Signaling). Following the incubations, Laemli’s buffer (12 μL) and 1 mM dithiothreitol (6 μL) were then added to samples, heated for 95 °C for 13 min, and subjected to western blotting. Antibodies used for western blotting were all used at 1:1000 dilution and included ….active Rab5 (NewEast Biosciences, #26911)…… Uncropped western blot films are shown in Supplementary Figs. 5–7, and corresponding densitometry analyses are shown in Supplementary Figs. 8–11. In vitro PTEN activity assays were performed using a commercially available kit according to the manufacturer’s recommendations (Echelon). In vitro ubiquitinylation studies were performed with SMURF2 (1 μg) and PTEN (1 μg, Cayman) proteins using a commercially available kit (Ubiquitinylation Kit, Enzo).
Membrane attack complex-induced and endosome-dependent stabilization of ZFYVE21. Human umbilical vein endothelial cells (HUVECs) were treated with panel reactive antibody (PRA) sera (25% v/v in gelatin veronal buffer) (a). HUVECs were treated with MG132 (25 μM) (b). HUVECs were treated with IgG+ and IgG− sera fractions from PRA and C6-deficient sera (50% v/v in gelatin veronal buffer) for 30 min prior to western blotting (c, left). HUVECs were treated with IgG+ and IgG− sera fractions from PRA sera, IgG− sera fractions from C9-deficient sera, C9 AF647, or in combination for 30 min (c, right). HUVECs were pretreated with Dynasore (80 μM) or Pitstop2 (30 μM) for 30 min, d). HUVECs stably transduced with Rab5 wild type (WT) or Rab5 dominant negative (DN) (S43N) were treated with PRA prior to co-immunoprecipitation of Rab5 (e). Three-color confocal microscopy of PRA-treated (f, top scale bar 8 μm, bottom scale bar 530 nm). Recombinant ZFYVE21 (1 μg) was co-incubated with lipid-coated beads and probed by Western blot (g). HUVECs were treated for 30 min with KU-55933 prior to blotting of Rab5 co-immunoprecipitates (h) and whole-cell lysates (i). HUVECs stably transduced with control or MTM1-expressing vectors were treated with PRA sera for 30 min prior to Rab5 co-immunoprecipitation (j). Rab5+ZFVYE21+ endosomes were quantified by confocal microscopy (5 nM, k, top row, scale bar: 10 μm). Intermolecule distances between Rab5 and ZFYVE21 were calculated using super-resolution microscopy (k, bottom row, scale bar: 10 μm). Myc-tagged ZFYVE21 was used in far western blots (l, left blot). Far western blot membranes were stripped and probed by western blot (l, right three blots). Recombinant Rab5 (m, top), Rab5 WT, or Rab5 DN (m, bottom) were incubated with GDP or GTPγS prior to addition of ZFYVE21. HUVECs transfected with control or ZFYVE21 siRNA (n). HUVECs transfected with control of ZFYVE21 siRNA were treated with PRA for 4 h prior to immunofluorescence (I.F.) analysis (o, p, scale bar: 85 μm). Lipid reporter mean fluorescent intensity PI(3)P:PI(3,4,5)P3 ratios gated on C9+Rab5+ vesicles were calculated (q, r, scale bar: 10 μm). *p < 0.05, analysis of variance. For I.F., ≥3 fields were analyzed per group per experiment, and each experiment was repeated two times. For confocal microscopy analyses, ≥10 individual cells were analyzed per group, and each experiment was repeated four times. Super-resolution microscopy was repeated twice. All western blot assays were conducted two to four times. Representative data shown
2.8 ∣. Rab5 activity assay
The activity of Rab5 was assessed by a Rab5 activation assay kit (83701; NewEast Biosciences, King of Prussia, PA), according to the manufacturer’s recommended protocol. In brief, cell lysates containing equal amounts of proteins in equal volumes were incubated with a mouse monoclonal antibody specifically recognizing GTP-bound Rab5, and protein A/G agarose beads were later added into pull down GTP-bound Rab5. After the agarose beads were washed, a sample buffer was added in to elute active Rab5 for WB using a rabbit polyclonal anti-Rab5 antibody.
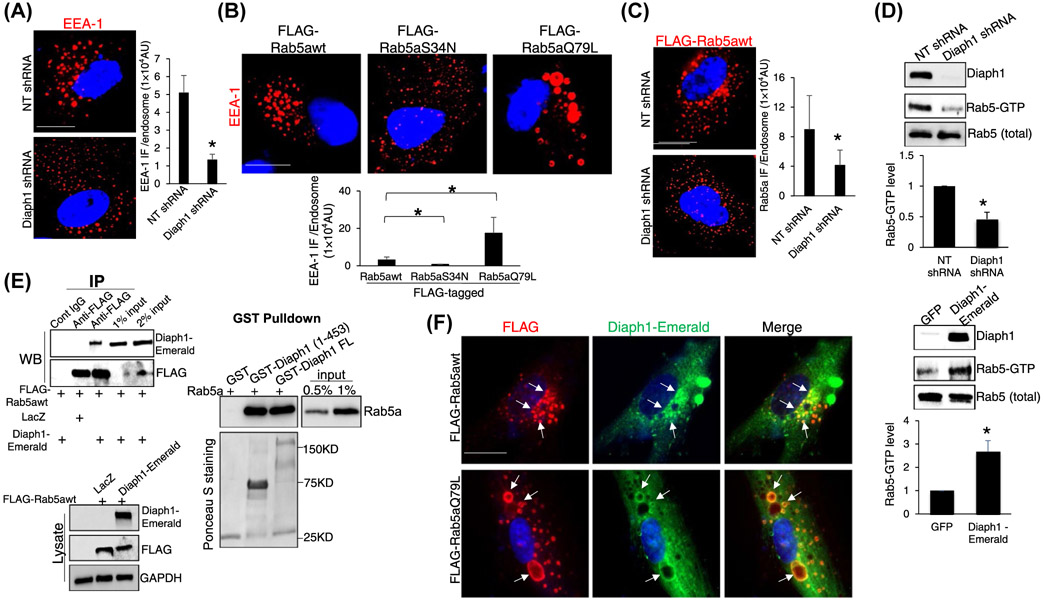
Diaph1 interacts with Rab5 and promotes Rab5 activity. A, HSCs expressing NT or Diaph1 shRNA were subjected to IF for EEA-1. Quantitative data are shown on the right. Diaph1 shRNA reduced the EEA-1 IF density of each endosome. *P < .05 by t test, n = 6 cells each group. Bar, 20 μm. B, HSCs expressing FLAG-Rab5awt, FLAG-Rab5S34N (inactive), or FLAG-Rab5aQ79L (constitutively active) by retroviral transduction were subjected to IF for EEA-1. FLAG-Rab5aQ79L increased whereas FLAG-Rab5S34N reduced EEA-1 IF density of each endosome, compared to FLAG-Rab5awt. *P < .05 by t test, n = 6 cells each group. Bar, 20 μm. C, HSCs expressing FLAG-Rab5awt were transduced by NT shRNA or Diaph1 shRNA lentiviruses and cells were subjected to IF for FLAG. Diaph1 shRNA reduced Rab5a IF density of each endosome. *P < .05 by t test, n = 6 cells each group. Bar, 20 μm. D, HSCs expressing NT, Diaph1 shRNA, GFP, or Diaph1-Emerald were collected and subjected to Rab5 activity measurement using a Rab5 activation assay kit. Diaph1 shRNA reduced (upper) whereas overexpression of Diaph1 (lower) increased the level of GTP bound Rab5a. *P < .05 by t test. n = 3. E, Left, HSCs expressing FLAG-Rab5awt were transduced by LacZ or Diaph1-Emerald retroviruses and cells were subjected to IP. Anti-FLAG was used to pull down FLAG-Rab5a and coprecipitated Diaph1-Emerald was detected by WB using anti-GFP antibody. Diaph1 and Rab5a interacted in HSCs. Right, GST-fused Diaph1 proteins were purified from bacteria and used for GST pull down assay. Diaph1-bound Rab5a was quantitated by WB. GST fusion proteins were shown by Ponceau S staining. F, HSCs expressing Diaph1-Emerald were transduced with retroviruses encoding FLAG-Rab5awt or FLAG-Rab5aQ79L and cells were subjected to IF for FLAG (red) and GFP (green). Diaph1-Emerald colocalized with FLAG-Rab5awt and FLAG-Rab5aQ79L (arrows) in HSCs. Bar, 20 μm
2.8 ∣. Rab5 activity assay
The activity of Rab5 was assessed by a Rab5 activation assay kit (83701; NewEast Biosciences, King of Prussia, PA), according to the manufacturer’s recommended protocol. In brief, cell lysates containing equal amounts of proteins in equal volumes were incubated with a mouse monoclonal antibody specifically recognizing GTP-bound Rab5, and protein A/G agarose beads were later added into pull down GTP-bound Rab5. After the agarose beads were washed, a sample buffer was added in to elute active Rab5 for WB using a rabbit polyclonal anti-Rab5 antibody.
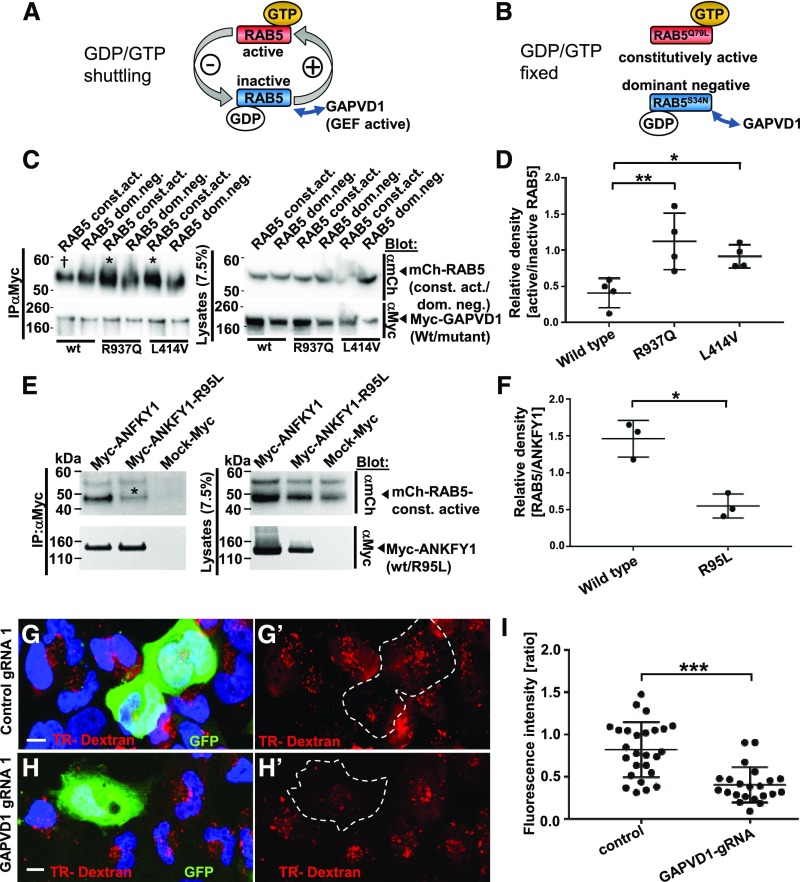
Mutations of GAPVD1 that cause nephrotic syndrome increase the affinity to active RAB5, and GAPVD1 promotes dextran endocytosis.
(A and B) Schematic showing that (A) RAB5 shuttles between active and inactive states dependent on binding to GTP/GDP, whereas (B) dominant negative and constitutively active RAB5 constructs are clamped to active and inactive states, respectively. (C) Overexpression and co-IP of mCherry-tagged RAB5 dominant negative (RAB5 dom. neg.) and constitutively active (RAB5 const. act.) constructs together with Myc-GAPVD1 reflecting the wild-type (WT) sequence or mutations causing nephrotic syndrome (R937Q and L414V). WT and mutant GAPVD1 interact with active and inactive RAB5. The mutant constructs of GAPVD1 show a stronger affinity to constitutively active RAB5 (asterisks) compared with WT GAPVD1 († sign). (D) Quantitation of density from precipitates analogous to (C) normalized to respectively precipitated RAB5 construct for co-IPs and shown as a ratio of RAB5 const. act. divided by RAB5 dom. neg. (n=4, P<0.05 or 0.01, respectively). (E) Overexpression and co-IP of mCherry-tagged constitutively active RAB5 together with Myc-ANFKY1 reflecting the WT sequence or the R95L mutation shows strongly reduced amounts of RAB5 precipitating with the mutant ANKFY1 (asterisk), indicating a reduced binding affinity.
Immunoprecipitation
Immunoprecipitation of Rab5-GTP or Rab7-GTP from MoDCs using (Cat. No. 83701, NewEast Biosciences) and Anti-Active Rab7 Mouse Monoclonal Antibody (Cat. No. 26923, NewEast Biosciences) according to the manufacturer protocol with some modifications. Briefly, cells were lysed using 1× Assay/Lysis Buffer with 10 µg/ml aprotinin, 10 µg/ml leupeptin, 1.25 µg/ml pepstatin A, 1 mM PMSF for 30–45 min on ice. Lysates were centrifuged at 13,000×g, 4°C for 30–45 min. Supernatants were collected and protein concentration was measured using Pierce™ BCA Protein Assay Kit according to manufacturer’s instructions. Afterward, lysates were incubated with either Mouse anti-Rab5-GTP or Mouse anti-Rab7-GTP primary antibody (1 µg) pre-conjugated with protein A/G agarose slurry (20 µl) in 500 µl of 1× Assay/Lysis Buffer with protease inhibitors for a maximum of 2 h, 4°C, with gentle rotation for immunoprecipitation. Afterward, 5× loading buffer was used to elute the targeted proteins by boiling at 98°C for 5 min and the protein lysates were subjected to SDS-PAGE as described above. Membranes were blocked with TBS-T + 3% BSA and incubated with either Rabbit anti-Rab5 or Mouse anti-Rab7 primary antibody (1:1,000) in TBS-T + 3% BSA overnight at 4°C, followed by incubating with Recombinant Protein G (HRP) Cat. No. (ab7460, Abcam) (1:1,000) in TBS-T + 3% BSA for 1 h at room temperature. Membrane blots were developed using SuperSignal™ West Pico PLUS Chemiluminescent Substrate or SuperSignal™ West Femto Maximum Sensitivity Substrate. Signals were detected by ChemiDoc (Bio-Rad) and quantified using ImageJ software. A total of 25 µg of total cell lysates were used as input control.
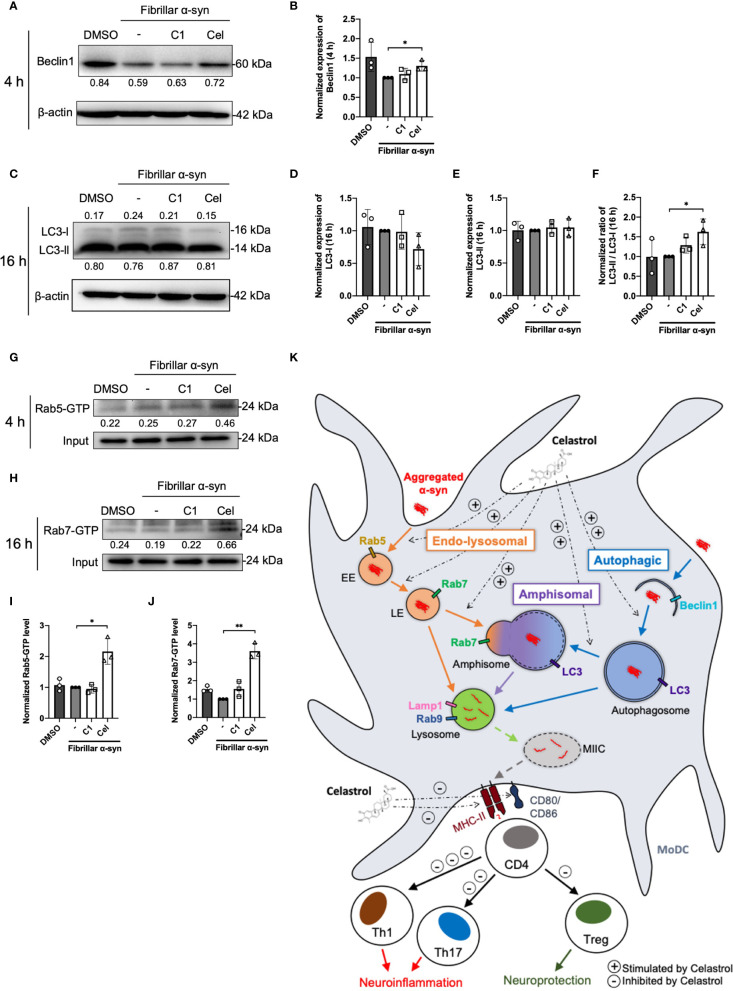
Autophagosome markers and Rab-GTP protein expression level in α-syn treated MoDCs.
(A) The expression of Beclin1 in drug pre-treated MoDCs was determined by Western Blot at 4 h post α-syn treatment. Relative expressions of Beclin1 to β-actin were quantified by ImageJ and indicated on the blots, which were further normalized to α-syn only treatment shown in (B). Column graph data represents mean ± SD from 3 individual experiments. (C) The expressions of LC3-I and LC3-II in drug pre-treated MoDCs were determined by Western Blot at 16 h post α-syn treatment. Relative expressions of LC3-I or LC3-II to β-actin were quantified using ImageJ and indicated on the blots, which were further normalized to α-syn only treatment shown in (D, E). (F) The ratio of LC3-II to LC3-I in each treatment was calculated and further normalized to α-syn only treatment. Column graph data represents mean ± SD from 3 individual experiments. (G) Active Rab5-GTP (H) and Rab7-GTP were immunoprecipitated and their relative expressions towards whole cell lysate input control were quantified by ImageJ and indicated on blots, which were further normalized to α-syn only treatment shown in (I, J). Column graph data represents mean ± SD from 3 individual experiments. Statistical significance was calculated by one-way ANOVA and Tukey’s multiple comparisons test, *P < 0.05, **P < 0.01. (K) Schematic diagram of α-syn aggregates trafficking in MoDCs underlying antigen presentation and CD4+ T cell activation. Following uptake, α-syn interacts with components of three antigen trafficking and processing pathways: 1) Endo-lysosomal pathway (orange) beginning from Rab5+ early endosome (EE) to Rab7+ late endosome (LE) and to Rab9+/Lamp1+ lysosome degradation; 2) autophagic pathway (blue) starting from autophagosome formation (Beclin1+) enclosing aggregated α-syn, matured with LC3 and then to Rab9+/Lamp1+ lysosome degradation; 3) amphisomal pathway (purple) involves the fusion of Rab7+ LE from the endo-lysosomal pathway with LC3+ autophagosome from the autophagic pathway, which may also be regulated by the formation of Rab5+/Beclin1+ vesicles, and consequently fuse with Rab9+/Lamp1+ lysosomes. These three pathways could possibly allow the processing of the encapsulated α-syn by lysosomes and provide α-syn antigen peptides at different extent for MHC-II presentation to CD4+ T cells and trigger differentiation into Th1, Th17 and Treg subsets that may contribute to either neuroinflammation or neuroprotection. Celastrol promotes the colocalization of α-syn with Rab5+ EE and Rab7+ LE in the endo-lysosomal pathway, with autophagosome in the autophagic pathway, and the formation of amphisome containing α-syn in the amphisomal pathway. The increased α-syn interaction with components from degradation pathways likely favored the processing of α-syn and reduced α-syn peptides presentation to CD4+ T cell and decreased the frequencies of Th1, Th17 and Treg subsets.
Immunocytochemistry and western blot analysis of preclinical samples
Immunohistochemistry was performed on 40 mm thick vibratome sections18,70 using commercial antibodies against Rab5-GTP (NewEast, 26911; 1:50), ChAT (Millipore Sigma; AB144; 1:250), Rab5 (Abcam; 18211; 1:1000) and visualized with either biotinylated (Vector Laboratories; 1:500) or fluorescence-conjugated secondary antibodies (Fisher Sci, 1:500) as previously described18,45,71. Briefly, sections were washed three times with antibody dilution buffer containing 1% bovine serum albumin (BSA, Sigma), 0.05% saponin (Sigma), 1% normal horse serum (NHS, Thermo Fisher) in Tris-buffered saline (TBS), blocked with 20%NHS in TBS for one hour at room temperature, before incubated with primary antibodies overnight (O/N) at 4 °C. Confocal image were collected using Zeiss LSM880 laser confocal microscope and Zen 2.1-Sp3 software72.
Morphometric analysis of Rab5-GTP puncta including intensity, number, average size and total area was determined by Fiji/ImageJ 2.3.0 (https://imagej.net/Fiji). Two male and two female mice were used and 20–30 neurons from each mouse were quantified and the means from each mouse were compiled.
For ChAT staining, sections were treated with 3% H2O2 before blocking, and incubated with anti-ChAT antibody (Millipore Sigma; AB144; 1:250). Diaminobenzidine (DAB) was visualized by incubating with biotinylated secondary antibody (1:500, Vector Laboratories) and Vectastain ABC kit (Vector Laboratories).
For protein analyses, mouse brain tissues were homogenized and western blot analyses were performed with antibodies against APP (c1/6.1; 1:1000), bCTF (M3.2, 1:250)18, BACE1 (Rockland; 200-401-984; 1:500), MAPKAPK-2 (MK2; Cell Signaling; 12155; 1:500), phospho-MK2 (Cell Signaling; 3007; 1:500), p38 MAPK (p38α; Cell Signaling; 9218; 1:500), phosphor-p38 (Santa Cruz; 166182; 1:500), MNK1 (Cell Signaling; 2195; 1:500), pMNK1 (Cell Signaling; 2111; 1:500), β-actin (Santa Cruz Biotechnology; sc-47778; 1:2000). All the secondary antibodies for western blot analyses were used according to the manufacturer’s recommendations (Jackson ImmunoResearch Laboratories, PA). A digital gel imager (Syn-gene G:Box XX9) was used to capture the ECL images and band intensities were quantified with Fiji/ImageJ 2.3.0 using β-actin as an internal control. Sizes of Rab5+ endosomes were determined by Image J, as previously described18,45,71.
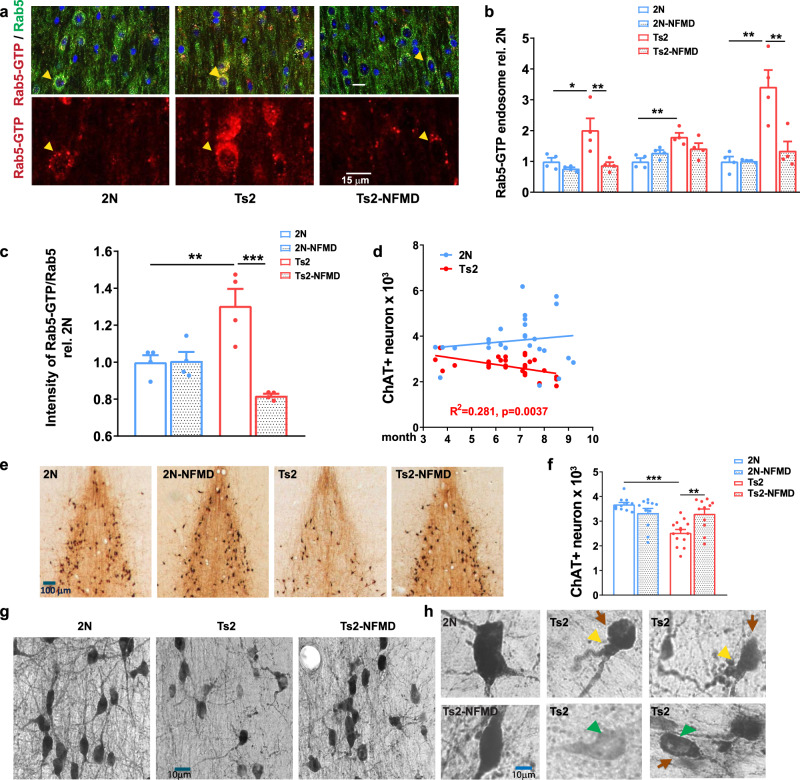
Normalized Rab5+ endosome number/size and restored cholinergic neuronal numbers in Ts2 mice treated with neflamapimod (NFMD).
a Representative images of medial septal nucleus (MSN) regions from vehicle-treated wildtype (2 N, n = 4), vehicle-treated Ts2 (n = 4) and NFMD-treated Ts2 (Ts2-NFMD) mice, labeled with Rab5-GTP (red) and Rab5a (green) antibodies; arrows point to the Rab5-positive neurons, which are shown enlarged in the lower panel (scale bar, 15 μm). b The numbers, sizes and areas of Rab5-GTP-positive endosomes determined by Image J analysis [n = 4 mice per group; for number: F(3,12) = 7.789, R square = 0.661; for 2 N vs Ts2 p = 0.0202, 95% CI = −1.880, −0.151; for Ts2 vs Ts2-NFMD p = 0.0097, 95% CI = 0.273, 2.002; for size: F(3,12) = 6.939, R square = 0.634, for 2 N vs Ts2 p = 0.0036, 95% CI = −1.329, −0.269; for area: F(3,12) = 13.19, R square = 0.767; for 2 N vs Ts2 p = 0.0009; 95% CI = −3.766, −1.079; for Ts2 vs Ts2-NFMD p = 0.0030, 95% CI = 0.7325, 3.419]. c The ratio of Rab5-GTP to total Rab5 intensities determined with Image J [n = 4 mice per group; F(3,12) = 13.23, R square = 0.768; for 2 N vs Ts2 p = 0.001, 95% CI = −0.537, −0.073; for Ts2 vs Ts2-NFMD p = 0.0002, 95% CI = 0.254, 0.719]. d The number of stereologically counted ChAT+ neurons in the MSN region of 2 N (n = 27) and Ts2 (n = 28) mice was graphed versus age of mice in months (Linear regression F = 10.16, R square = 0.281, p = 0.0037, 95% CI = −0.259, −0.056 for Ts2; F = 0.548, R square = 0.0215, p = 0.466, 95% CI = -infinity, −3.98) for 2N. e Representative images of diaminobenzidine (DAB)-stained ChAT+ neurons in the MSN region of 2 N and Ts2 mice treated with either vehicle or NFMD (scale bar, 100 μm). f Quantification of DAB-stained ChAT+ neurons in the MSN region; n = 10 (2 N), n = 11 (2N-NFMD), n = 14 (Ts2) and n = 11 (Ts2-NFMD) mice (F(3, 43) = 11.10, R square = 0.436, for 2 N vs Ts2, p < 0.0001, 95% CI = 0.588, 1.712; for Ts2 vs Ts2-NFMD p = 0.0037, 95% CI = −1.331, −207). g, h Abnormal morphology of ChAT+ neurons was consistently and reproducibly seen in the MSN of Ts2 mice, with swelling (yellow arrows), perikaryal atrophy (red arrows) and below normal ChAT immunoreactivity intensity (green arrows) in the representative images (scale bar,10 μm). Data are presented as mean values ± SEM. Graph made and analyzed with GraphPad Prism8.0.1 with Ordinary One-Way ANOVA/Tukey correction. Statistical significance is represented by asterisks *p ≤ 0.05, **p ≤ 0.01, ***p ≤ 0.001. Source data are provided as a Source Data File.
Morphometric analyses
For quantification of Rab5a and Rab5-GTP positive puncta, coronal sections containing both cortex and hippocampus were used. For the cortical region, ~30–50 neurons per animal (n = 3–6/genotype) were individually analyzed from 40× magnification images with zoom value of one (212.55 × 212.55 μm2) or 3×-zoomed (70.85 × 70.85 μm2). For the CA1 region, Rab5 puncta in stratum pyramydale and stratum radiatum were determined from 40× magnification images containing ~30–50 neurons/field (n = 3/genotype). Image analysis was performed using Fiji/ImageJ software (Schindelin et al., 2012). Following background subtraction using a rolling ball radius of 50 and Yen’s method image thresholding, Rab5 puncta intensity, size and area fraction/cell (cortex) or area fraction/field (CA1) were determined. Data are expressed as mean ± Standard Error of the Mean (SEM) relative to WT and represented as bar graphs showing individual data points for each mouse.
Rab5-GTP antibody specificity ex vivo was determined by colocalization analysis of Rab5a and Rab5-GTP in cortical neurons using the ImageJ software JACoP Plug-In (Jiang et al., 2019a). Rab5-GTP antibody validation for use in IF in vitro in non-neuronal cells has been previously shown (Mani et al., 2016) and confirmed by us in murine neuroblastoma cells based on our previous work (not shown) (Kim et al., 2016).
Rab5-GTP pull-down assays from hippocampal homogenates and synaptosomes
The amount of Rab5-GTP was assayed in total hippocampal homogenates and SS preparations by two methods: 1) by GTP-Agarose pull-down (Fang et al., 2017; Xu et al., 2016; Zhang et al., 2013); 2) by immunoprecipitation (IP) with the Rab5-GTP antibody (modified protocol from NewEast Biosciences Rab5 activation assay kit cat. N. 8370). The GTP-agarose pull down assay measures the levels of GTP-bound Rab5, by reflecting the guanine nucleotide exchange activity of a GEF protein (e.g., RabGEF-1) toward Rab5 (Shi et al., 2018). For this assay, mouse hippocampi were lysed in GTP-Agarose lysis/wash buffer (50 mM Tris-HCl pH 7.5, 250 mM NaCl, 5 mM Mg acetate, 0.5% Triton X-100, and protease inhibitors), followed by centrifugation at 13,000 × g for 10 min at 4°C. An aliquot of supernatants (30 μl) was saved as the loading control and ~0.5–1 mg were incubated with 300 μL of GTP-agarose beads (Sigma Cat# G9768) for 4h at 4°C with rotation. Alternatively, SS pellets, isolated as described above, were resuspended in GTP-Agarose lysis buffer, incubated on ice for 30 min and sonicated. After saving an aliquot as loading control, ~0.2 mg of SS proteins were incubated with 300 μL GTP-agarose beads O/N at 4°C with rotation. For IP, isolated SS were homogenized in IP/wash buffer (50 mM Tris, pH 7.4, 150 mM NaCl, 1mM MgCl2, 1 mM EDTA, 1% Triton), incubated on ice for 30 min and sonicated. After saving an aliquot, ~0.2 mg of SS proteins in 300 μL of IP/wash buffer were incubated with anti-Rab5-GTP-, or Normal Mouse IgG (negative control)- crosslinked PureProteome™ Protein A/G Magnetic beads (Millipore Sigma) O/N at 4°C with rotation. The cross-linking reaction was carried out to minimize co-IP of non-specific IgG in amine-free buffer using bis (sulfosuccinimidyl) suberate (BS3), following the manufacturer’s instructions (ThermoFisher Scientific). A separate reaction was carried out in the presence of 10 μM GTPγS, a non-hydrolyzable G-protein-activating analog of GTP, at 30°C for 30 min, prior to IP to stabilize active Rab5 (positive control). The same reaction in the GTP-Agarose pull-down assay served to control for specific binding. The beads were then washed with respective wash buffer, resuspended in Laemmli sample buffer and boiled. The amount of Rab5-GTP was measured following SDS-PAGE and blotting with an anti-Rab5 antibody and the results expressed as Rab5-GTP/total rab5.
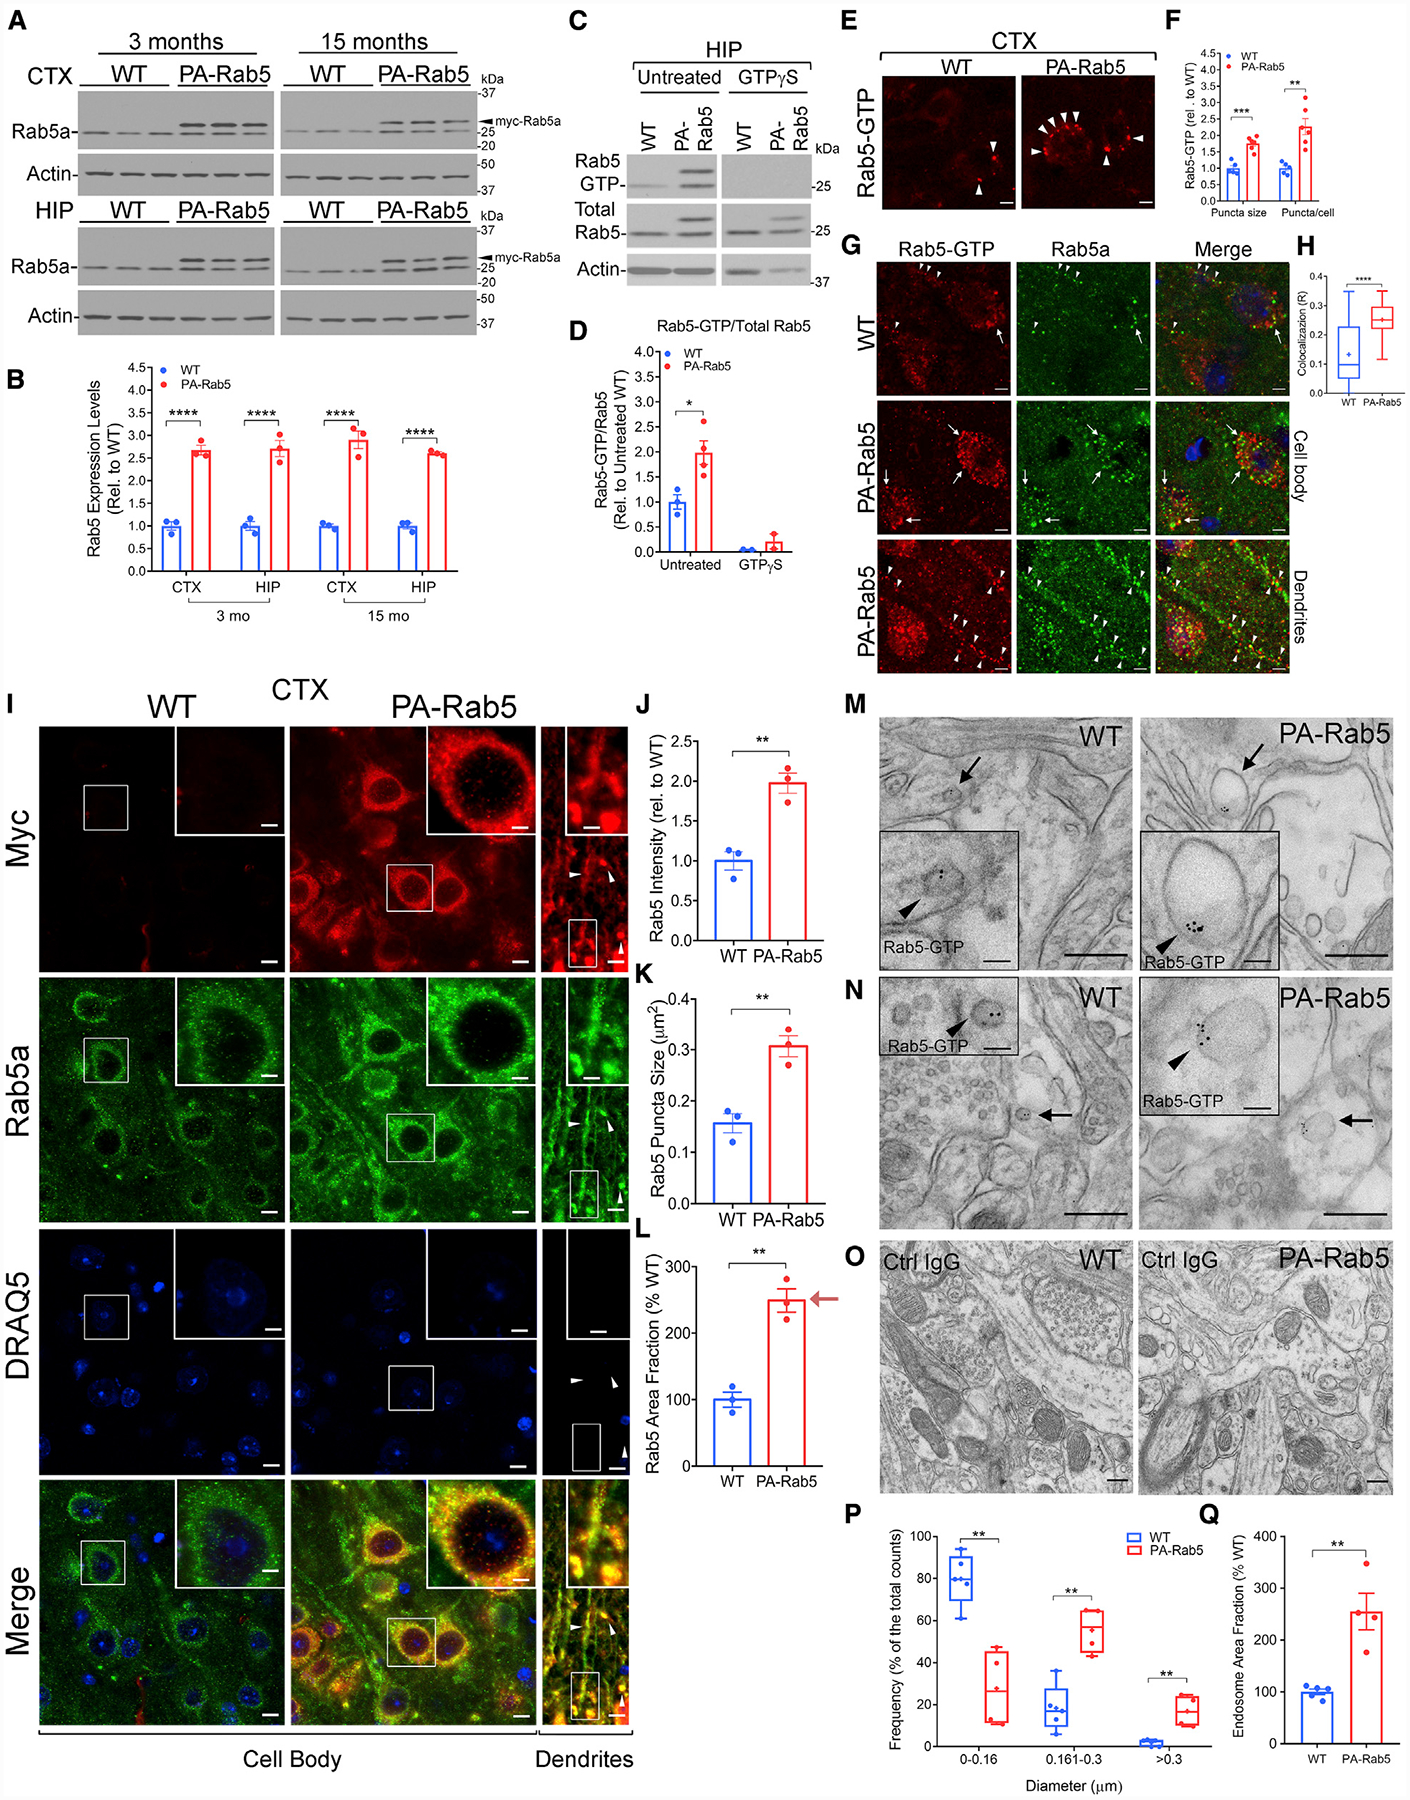
(C and D) Representative western blots (C) and quantification (D) of Rab5 activation in 6-month-old WT and PA-Rab5 HIP by GTP-agarose pull-down and detection with a Rab5a antibody. Rab5 activation is expressed as Rab5-GTP/total Rab5. Pre-treatment with GTPγ-S before pull-down served as negative control. Data normalized to the untreated WT control group (1-way ANOVA with Dunnett’s post hoc test; untreated WT n = 3, PA-Rab5 n = 4; GTPγ-S-treated WT n = 2, PA-Rab5 n = 2). See also Figures S1D–S1G.
(E and F) Representative confocal images (E) and quantification (F) of activated Rab5 in the CTX at 7 months. Rab5-GTP puncta (arrowheads) size and number per cell are increased in PA-Rab5, compared to WT (WT n = 5; PA-Rab5 n = 6). Scale bars, 5 μm.
(G) Representative confocal images of WT and PA-Rab5 cortical neurons displaying Rab5-GTP (red) and anti-Rab5a (green) localization in the cell body (arrows) and dendrites (arrowheads). Cell nuclei were counterstained with DRAQ5 (blue). Scale bars, 5 μm.
(H) Colocalization analysis (R) of Rab5-GTP and Rab5a by Pearson’s correlation coefficient (R: WT = 0.124 ± 0.02 PA-Rab5 = 0.252 ± 0.01; n = 30 cells/genotype).
(M–O) Post-embedding immunogold EM identified enlarged Rab5-GTP+ vesicles (arrows and arrowheads in respective insets) in neurites (M) and post-synaptic terminals (N) of PA-Rab5 prefrontal cortex (PFC) layer V, compared to WT. (O) No gold particles were detected in samples incubated with mouse immunoglobulin G (IgG) isotype control. Scale bars, 250 nm; inset, 50 nm.
Rab5-GTP activation assay
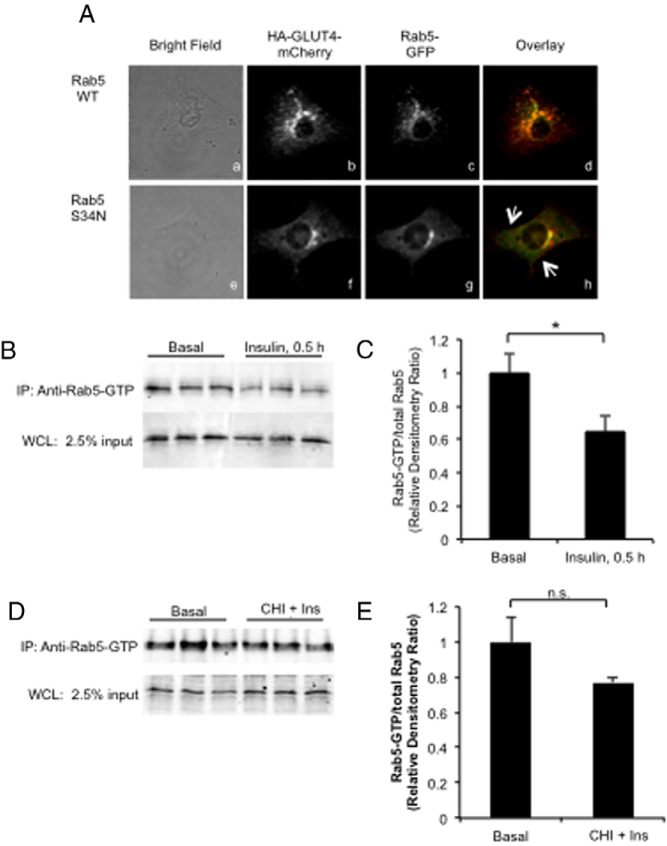
Day 5 postdifferentiated 3T3-L1 adipocytes were stimulated acutely with 10 nM insulin for 30 minutes at 37°C or treated without or with CHI as described above with acute restimulation with 10 nM insulin. Whole-cell lysates were prepared in lysis buffer (25 mM Tris, pH 7.4; 30 mM MgCl2; 150 mM NaCl; 1% NP-40; 2 mM sodium vanadate complexes; 1 mM phenylmethylsulfonyl fluoride; and 1× protease Inhibitors). Equal total protein was immunoprecipitated with α-active Rab5 mouse monoclonal antibody (Neweast Biosciences). Complexes were separated by SDS-PAGE and prepared for immunoblot as described above.
Acute insulin stimulation promotes Rab5 activity-dependent formation of rapid recycling peripheral GLUT4 pool. A, Colocalization of HA-GLUT4-mCherry and GFP-Rab5 WT (panels Aa–Ad) and GFP-Rab5 S34N mutant (panels Ae–Ah) were analyzed by confocal microscopy. The arrows indicate the accumulation of small HA-GLUT4-mCherry vesicles at the margins of the cell (panel Ah). B–E, 3T3-L1 adipocytes expressing Rab5-GTP WT were acutely stimulated with insulin (panels B and C) or treated with CHI followed by restimulation with 10 nM insulin for 30 minutes (panels D and E), and then Rab5-GTP was immunoprecipitated from whole-cell lysates as described in Materials and Methods using a Rab5-GTP-specific antibody. Immunoprecipitated Rab5-GTP was analyzed by immunoblot using antibody against Rab5 as described in Materials and Methods. Representative images from n = 3 are shown. Quantification of Rab5-GTP was reported as mean and SE. All data were analyzed using a Student’s t test. *, P < .05. Ins, insulin; IP, immunoprecipitation; WCL, whole-cell lysate.
Rab GTPase activity
Rab5 and Rab11 GTPase activity was determined using Rab5 activation assay kit (NewEast Biosciences, Catalog # 83701) and Rab11 activation assay kit (NewEast Biosciences, Catalog # 83201), respectively.
PICALM interacts with Rab5 and Rab11 during Aβ transcytosis across endothelial monolayer
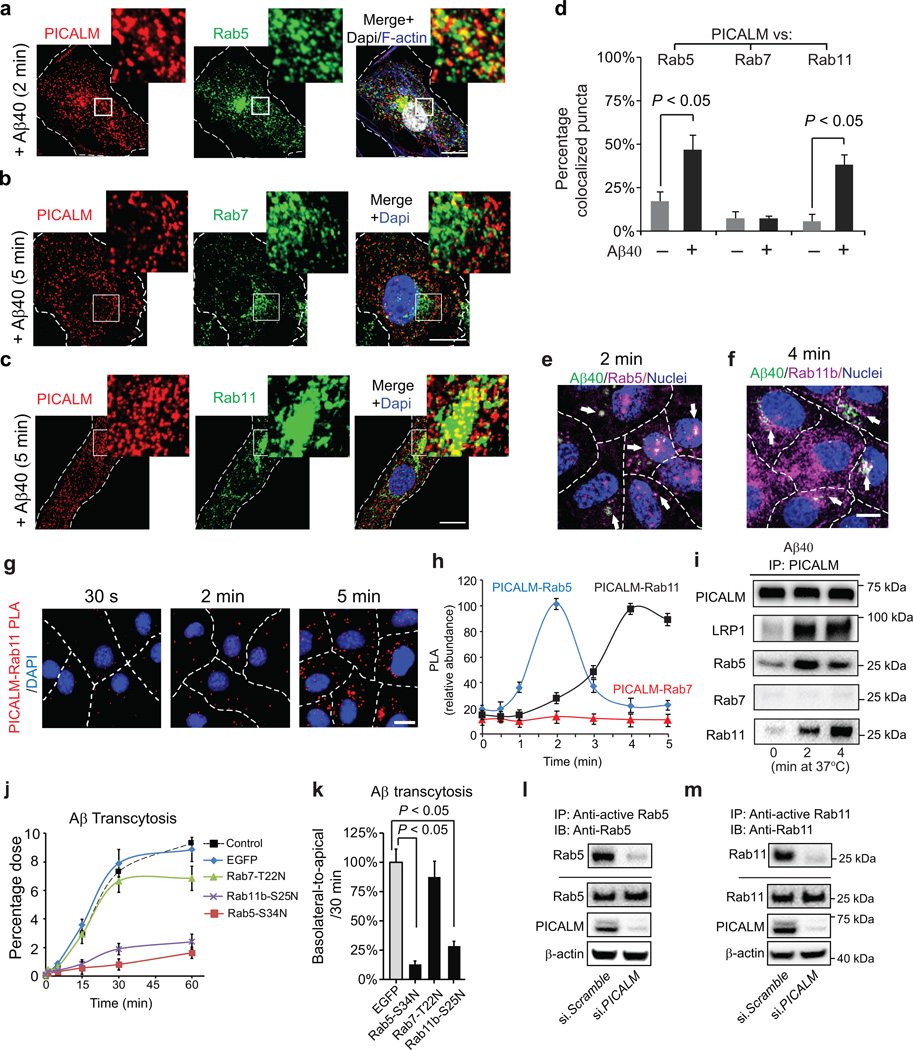
a, Colocalization between PICALM (red) and Rab5 (green) in primary human brain endothelial cells (BEC) cultured with FAM–Aβ40 (250 nM) for 2 min. b, Lack of association between PICALM (red) and Rab7 (green) in BEC cultured with FAM–Aβ40 for 5 min. c, Colocalization between PICALM (red) and Rab11 (green) in BEC cultured with FAM–Aβ40 for 5 min. Dapi, nuclear staining (blue). Insets: high magnification depicting colocalization. Bar=10 µm. d, Quantification of colocalization between PICALM and Rab5, Rab7, or Rab11 puncta in a–c. e–f, Colocalization of FAM–Aβ40 (green) with Rab5 (magenta, upper) or RAB11b (magenta, bottom) 2 and 4 min after Aβ internalization at the basolateral side of endothelial monolayer, respectively. Arrows denote co–localized white puncta. g–h, PLA of PICALM–Rab11 association (g, bar=10 µm) and kinetics of PICALM association with Rab5, Rab7 and Rab11 in endothelium after addition of Aβ40 (1 nM) to the basolateral membrane (h). i, Coimmunoprecipitation of LRP1, Rab5, Rab7 and Rab11 by PICALM–specific antibody (IP: PICALM) 0, 2 and 4 min after addition of Aβ40 (1 nM) to the basloateral membrane. j–k, Basolateral–to–apical transcytosis of Aβ40 (1 nM) across monolayer expressing dominant negative Rab5–S34N, Rab7–T22N or Rab11b–S25N mutants compared to control EGFP (100%) over 60 min (j) and quantification of unidirectional Aβ40 transport within 30 min (k). Mean ± s.e.m. from 3 primary isolates in triplicates. p<0.05 by ANOVA followed by Tukey’s posthoc test. l–m, Inhibition of Rab5 (l) and Rab11 (m) GTPase activity by si.PICALM compared to si.Scramble control.
Rab5 activation assay
The activation of Rab5 protein was detected by a configuration specific mAb-based Rab5 activation kit (New East Biosciences). Briefly, macrophages were seeded at 1 × 10⁸ cells ml− 1 and phagocytosis was activated as described earlier. Macrophages were then lysed with lysis buffer (New East Biosciences) according to the vendor’s instructions and lysates were incubated with anti-Rab5 GTP-bound form mAb and protein A/G-agarose bead slurry according to the instructions and incubated at 4 °C for 1 h. As a control, an equal amount of lysate protein was incubated only with protein A/G agarose beads. Finally, beads were washed with lysis buffer and resuspended in sample buffer for immunoblotting using rabbit polyclonal anti-Rab5 antibody (Cell Signalling). The positive control for this experiment was GTPγS-treated macrophage lysates and the negative control was GDP-treated cell lysates prepared as per the vendor’s instructions.
GTP levels of endogenous Rab5 during phagocytosis of P. aeruginosa in macrophages. Macrophages expressing vector alone were incubated with heat-inactivated P. aeruginosa
(•, a) or live (○, b) P. aeruginosa for various times (1 to 60 min) at 37 °C. Endogenous GTP-bound activated Rab5 was analysed by immunoblotting. The insets show representative immunoblots of samples probed with anti-Rab5 antibodies for total Rab5 and active Rab5, and with anti-tubulin antibodies (the control for total protein in the cell lysate). (c) ADP-ribosylation of endogenous Rab5 during phagocytosis of P. aeruginosa. Macrophages expressing vector alone were incubated with biotin-NAD supplemented media followed by infection with heat-inactivated (Hi) or live P. aeruginosa for various times (1 to 30 min) at 37 °C. Cells were then washed with ice-cold PBS, lysed and incubated with anti-Rab5 mAbs, followed by incubation with protein A/G agarose beads. After incubation, the beads were washed and Rab5 was analysed by immunoblotting with anti-Rab5 antibodies and avidin as described in Methods. Data represent the mean ± sem of three independent experiments. ADPr-Rab5, ADP-ribosylated Rab5; Pa, P. aeruginosa.
2.7. Rab5 Activation Assay
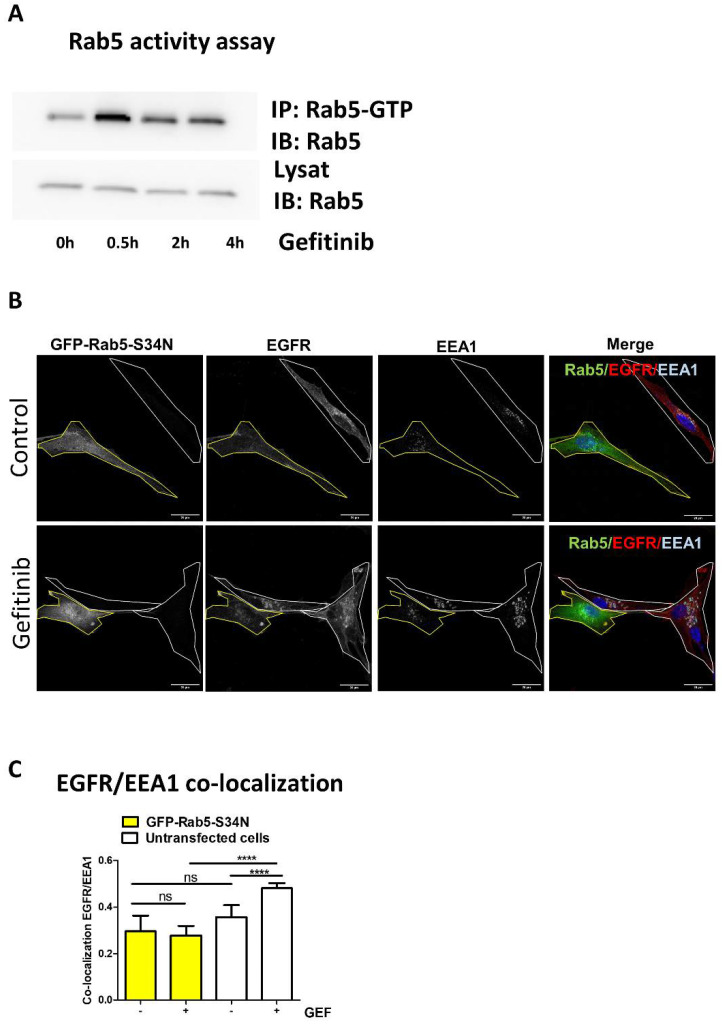
Upon gefitinib treatment, active Rab5 immunoprecipitation was performed using a conformation specific anti-active Rab5 antibody following the manufacturer’s instructions (NewEast Biosciences, King of Prussia, PA, USA). Rab5 protein in the total extract and in the immunoprecipitate was revealed using anti-Rab5 (D11) antibody by immunoblotting.
Gefitinib activates Rab5 to promote EGFR endocytosis.
(A) Rab5 activity assay was performed in cell lysates upon gefitinib treatment. U87 cells were seeded the day before gefitinib treatment (20 µM) for different periods of time. Cells were lysed and Rab5-GTP was immunoprecipitated. Rab5 was immunodetected in IP and control lysates. (B) U87 cells seeded on glass coverslips were transiently transfected with a dominant negative Rab5 mutant (GFP-Rab5-S34N). After treatment with gefitinib (4 h, 20 µM), cells were fixed, then EGFR and EEA1 were immunodetected and analysed by confocal imaging. Single or merged channel images are represented. Transfected cells are delimited in yellow in all images. Scale bar = 20 μm. (C) EGFR/EEA1 co-localisation upon gefitinib treatment in each untransfected cell (white bars) and GFP-Rab5-S34N expressing cell (yellow bars) was evaluated using Pearson’s correlation coefficient from 8 images (2–4 cells per images) in 3 independent experiments. Data reported as column histograms are the mean with 95% CI. **** p < 0.0001; ns: not significant.
Activity assay for Rab5
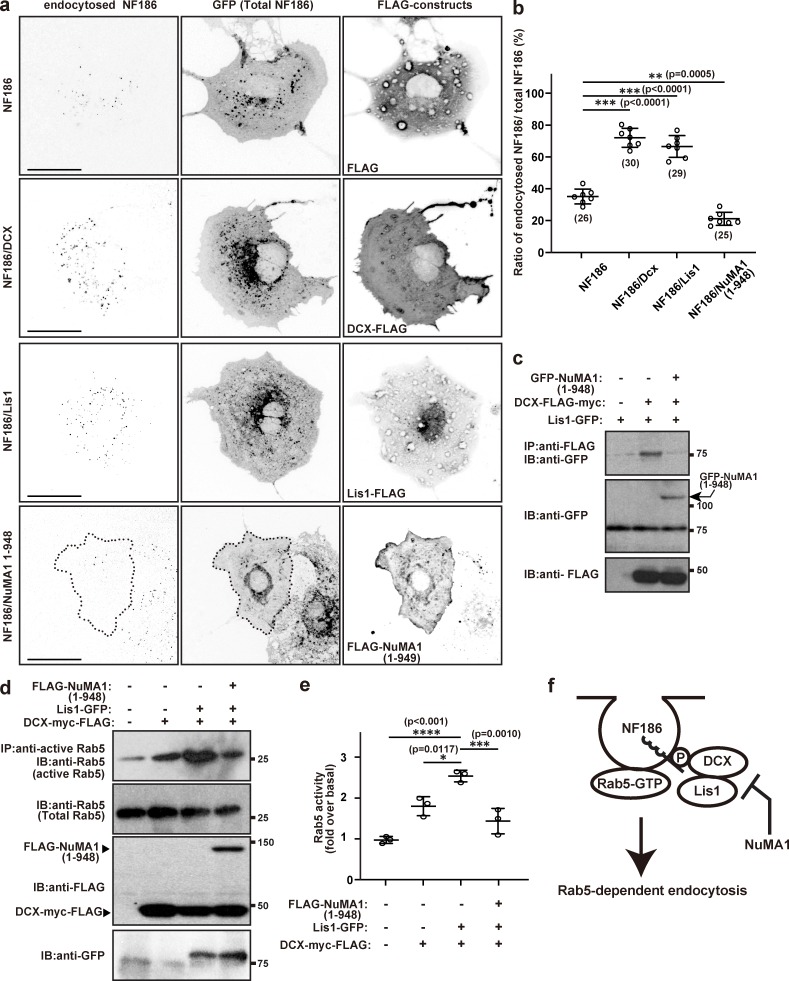
Rat NF186-GFP, Dcx-myc-FLAG, Lis1-GFP, and 3XFLAG-NuMA1 1–948 were transfected into COS-7 cells and incubated for 48 h. After incubation, cells were collected using lysis buffer and immunoprecipitated using anti-active Rab5 antibody. Activated Rab5 and total Rab5 were detected by immunoblotting using anti-Rab5 antibody.
NuMA1 inhibits endocytosis of NF186 by disrupting the interaction between Lis1 and DCX.
(a) Endocytosis assay in COS-7 cells for NF186 cotransfected with 3XFLAG vector, Dcx-FLAG, Lis1-FLAG, or FLAG-tagged NuMA1 (1–948). Scale bars = 10 µm. (b) Quantification of NF186 endocytosis in COS-7 cells. Mean ± SEM is shown (***, P < 0.001; **, P = 0.0005; n = 7 independent experiments, ordinary one-way ANOVA; the number of neurons analyzed for each condition is also shown). (c) GFP-NuMA1 (1–948), Lis1-GFP, and/or DCX-FLAG constructs were transfected into HEK293T cells and lysed after 48 h. Cell lysates were immunoprecipitated with an anti-FLAG antibody and immunoblotted with FLAG and GFP antibodies. (d) Rab5 activity assay in COS-7 cells. NF186-GFP, DCX-myc-FLAG, Lis1-myc-FLAG, and/or FLAG-NuMA1 1–948 mutant were transfected into COS-7 cells and lysed after 48 h of transfection. Cell lysates were immunoprecipitated using anti-active Rab5 antibody and immunoblotted with antibodies against Rab5, FLAG, and GFP. (e) Quantification of Rab5 activity over basal levels. Mean ± SEM is shown (****, P < 0.001; ***, P = 0.0010; *, P = 0.0117; n = 3 independent experiments, unpaired two-tailed Student’s t test). (f) Model for NuMA1-dependent inhibition of DCX–Lis1-mediated endocytosis of NF186. IB, immunoblot; IP, immunoprecipitation; P, phosphorylation.
Rab5 activation assay
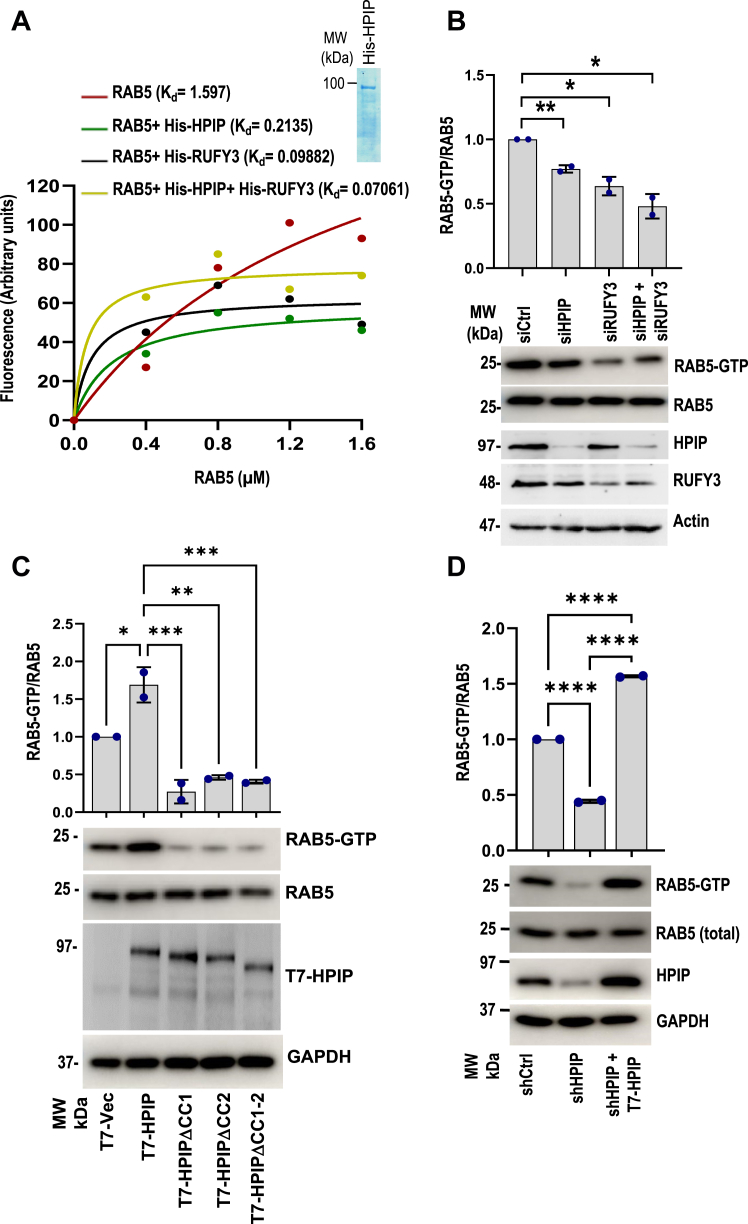
Rab5 activation assay was performed according to the manufacturer protocols (New East Biosciences). Forty-eight hours posttransfection of plasmid constructs or siRNA against the client proteins, cells were harvested, and 1 mg of protein extracts were immunoprecipitated using anti-Rab5(GTP) antibody for 1 h at 4 °C, followed by pulled down with AG beads and washed with 1× assay lysis buffer and were analyzed by Western blotting with respective antibodies.
HPIP and RUFY3 act as noncanonical guaninenucleotideexchange factors of Rab5.
A, MAN-GTP–binding assay demonstrating GEF activities of HPIP, RUFY3 toward Rab5. Inset, SDS-PAGE separation of purified His-HPIP. B, MDA-MB231 cells were transiently transfected with siCtrl, siHPIP, siRUFY3, or siHPIP and siRUFY3. Forty-eight hours post transfection, cell extracts were subjected to Rab5 activation assay as described in the Methods and analyzed by Western blotting as indicated (lower panel). Quantification of Rab5 activation (top panel). C, Rab5 activation assay demonstrating the loss of Rab5 activation in CC mutants of HPIP. MDA-MB231 cells were transiently transfected with control pcDNA vector, wt-HPIP, mtHPIPΔCC1, mtHPIPΔCC2, or mtHPIPΔCC1-2, 48 h post transfection, cell extracts were subjected to Rab5 activation assay as described in the Methods and analyzed by Western blotting as indicated (lower panel). Quantification of Rab5 activation (top panel). D, cell extracts of MDA-MB231 cells stably transfected with either shCtrl or shHPIP and T7-HPIP (for rescue) were immunoprecipitated using active Rab5 antibody, which specifically binds to Rab5-GTP form, and analyzed by Western blotting as indicated. Error bars indicate SD. ∗p = <0.05; ∗∗p = <0.001. CC, coiled-coil; GEF, guanine nucleotide exchange factor; HPIP, hematopoietic PBX–interacting protein.
Immunofluorescence assay
Cells with indicated treatments were fixed in 4% PFA and blocked in 5% bovine serum albumin containing 0.4% Triton X-100. Then, the cells were incubated using the indicated primary antibody at 4 °C overnight, followed by a fluorescent secondary antibody for 1 h at RT and stained with 5 μg/ml of DAPI for 5 min. The cellular fluorescence was photographed by a Zeiss AX10 microscope (Carl Zeiss, Göttingen, Germany).
Rab-GTP activity analysis
Activation of Rab5, Rab7, and Rab11 were analysed with Rab5, Rab7, and Rab11 Activation Assay Kits (NewEast Biosciences, King of Prussia, PA, USA). Briefly, 500 μg total protein lysed with 1× lysis buffer per sample were used in a Rab-GTP pull-down assay. Each sample was combined with anti-Rab-GTP monoclonal antibody and incubated at 4 °C overnight. Protein A/G agarose beads were used to capture the antibodies. After 1 h incubation at 4 °C, the beads were boiled in 2× loading buffer for 5 min. The supernatant was used for Western blot to detect Rab-GTP activity using Rab polyclonal antibody.
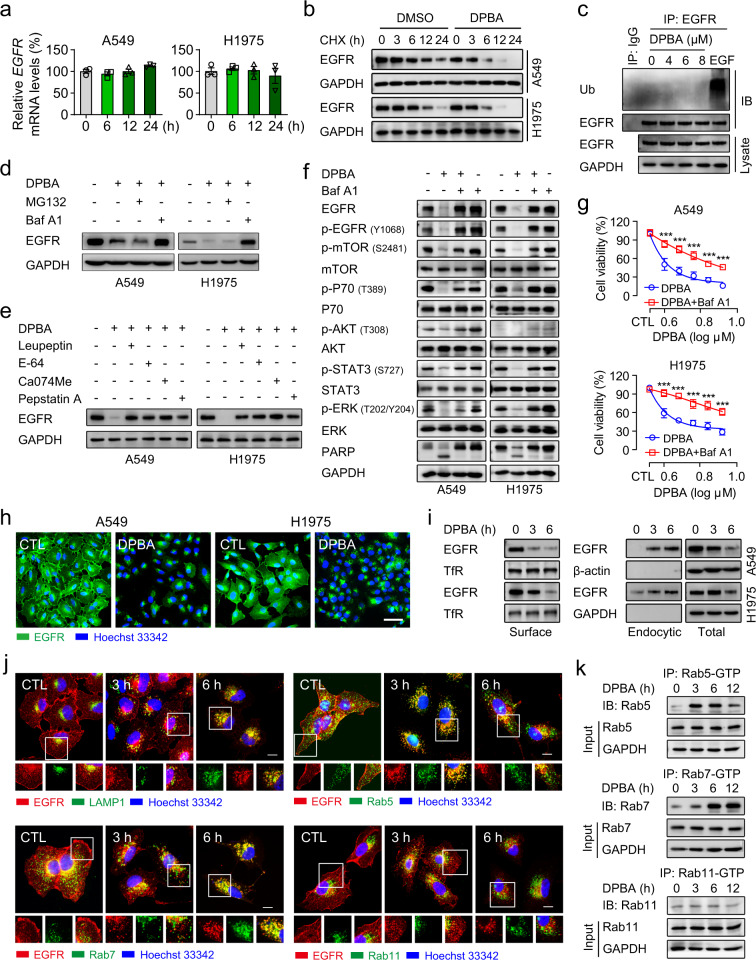
DPBA induces EGFR degradation in a lysosome-dependent manner.
a DPBA did not reduce EGFR mRNA level. A549 and H1975 were treated with DPBA (6 μM) for 6, 12, and 24 h. EGFR mRNA level was measured by RT-PCR, n = 3. b DPBA enhanced EGFR half-time degradation. A549 and H1975 were treated with CHX (20 μM) in the presence or absence of DPBA (6 μM) for the indicated times. EGFR protein levels were measured by Western blot. c DPBA did not induce EGFR ubiquitination. A549 was treated with DPBA (4, 6, or 8 μM) for 3 h or EGF (100 ng/ml) for 5 min, and EGFR ubiquitination was measured by Western blot. d A549 and H1975 were treated with DPBA (6 μM) with or without MG132 (10 μM) or Baf A1 (200 nM) for 12 h. EGFR protein levels were measured by Western blot. e A549 and H1975 were treated with DPBA (6 μM) with or without leupeptin (100 μM), E-64 (200 μM), Ca074Me (10 μM), or pepstatin A (100 μM) for 12 h. EGFR protein levels were measured by Western blot. f A549 and H1975 were treated with DPBA (6 μM) in the presence or absence of Baf A1 (200 nM) for 24 h. Activation of EGFR pathway were measured by Western blot. g A549 and H1975 were treated with various concentrations of DPBA in the presence or absence of Baf A1 (200 nM) for 24 h. Cell viability was detected by the MTT assay, ***P < 0.001 vs. DPBA, n = 3. h DPBA induced EGFR perinuclear accumulation. A549 and H1975 were treated with DPBA (6 μM) for 6 h. EGFR sublocalisation was detected by immunofluorescence (magnification, ×200; scale bar, 50 μm). i DPBA induced surface EGFR endocytosis. A549 and H1975 were treated with DPBA (6 μM) for 3 and 6 h. Surface and intracellular EGFR were measured by biotinylation assay. TfR was the loading control for surface protein. j DPBA induced EGFR trafficking through endo-lysosome route. A549 was treated with DPBA (6 μM) for 3 and 6 h. Colocalisation between EGFR and LAMP1, Rab5, Rab7, or Rab11 was detected by immunofluorescence (magnification, ×630; scale bar, 10 μm). k DPBA activated Rab5 and Rab7, but not Rab11. A549 was treated with DPBA (6 μM) for 3, 6, and 12 h. Rab-GTP expression was measured with a Rab Activation Assay Kit
Confocal microscopy and image analysis
HPMECs cultured for 6 days on transwell inserts (0.4 μm pore size, Corning, USA) were starved for 2 h in 1 % serum ECM and stimulated with 1 μg/ml LPS for 6 h. After stimulation, cells were briefly washed with phosphate-buffered saline (PBS) and fixed in 4 % paraformaldehyde for 30 min at 4 °C, permeabilized with 0.1 % Triton X-100 for 10 min, and blocked with PBS containing 2 % BSA for 1 h at room temperature. The cells and murine lung tissues sections were stained with specific antibodies, including anti-VE-cadherin, anti-Rab5a, or anti-Podxl antibodies at 4 °C overnight, followed by species-matched fluorescent secondary antibodies conjugated with Alexa Fluor 594, Alexa Fluor 488, or Dylight 649. To visualize F-actin, HPMECs were stained with rhodamine-phalloidin for 30 min. The nuclei were labeled with 4′, 6-diamidino-2-phenylindole (DAPI). After mounting in anti-fade mounting media, the cells were viewed and photographed with Leica confocal microscopy (Leica microsystems, Germany). Intracellular gap area and the apical/basal fluorescence intensity of the Podxl protein were calculated with Image J software (National Institute of Health, USA). Quantification of the F-actin fluorescence intensity was analyzed by using Leica LAS AF 2.3.0 software (Leica microsystems, Germany).
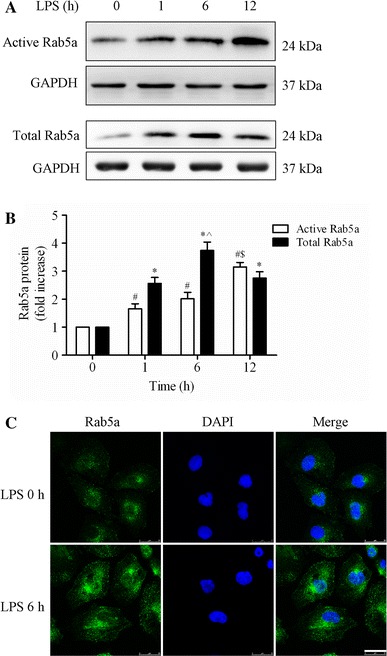
Effect of LPS on the activity and expression of Rab5a in HPMECs.
a Expression of active and total Rab5a was measured by pulldown assay and Western blotting (WB) using polyclonal antibodies against Rab5a. Representative blots showing active Rab5a (upper panel), relative GAPDH (2nd panel), total Rab5a (3rd panel), and GAPDH expression (lower panel) are shown. HPMECs were cultured and treated with LPS (1 μg/ml) for various time intervals (1, 6, and 12 h). b Quantitative data of active and total Rab5a expression normalized to GAPDH expression. The data are presented as the mean ± SE (n = 3). For active Rab5a, # p < 0.05 versus the 0 h group, $ p < 0.05 versus the 1 h group; for total Rab5a, *p < 0.05 versus the 0 h group, ^ p < 0.05 versus the 1 h group. c HPMECs were cultured on coverslips and then treated with 1 μg/ml LPS for 6 h, fixed, and stained with an anti-Rab5a polyclonal antibody. The images represent three separate experiments. Green, Rab5a; blue, DNA stained with DAPI (nuclei). Scale bar, 25 μm