
Published Pictures for 26901 Gαi-GTP mAb
Paint-fill and immunohistochemistry
Paint-fill analyses were performed as described previously (Grimsley-Myers et al., 2012). For immunostaining, temporal bones were fixed in 2 or 4% paraformaldehyde for 1 h at RT or in 10% TCA for 1 h on ice (indicated in the list in Table 1), then washed in PBS/glycine. Staining of whole-mount and cochlear cryo-sections was performed as previously described (Landin Malt et al., 2019). Briefly, cochlear sections or dissected cochleae were incubated in PBS containing 0.1% Triton X-100, 5% heat-inactivated goat/horse serum, and 0.02% NaN3 for 1 h at RT, followed by overnight incubation with primary antibodies at 4°C. After three washes, samples were incubated with secondary antibodies and phalloidin/Hoechst 33342, post-fixed and washed, and mounted in Mowiol with 5% N-propyl gallate.
Paraffin sections and immunohistochemistry
Embryos were dissected from pregnant mice at the time points indicated, fixed in 4% paraformaldehyde (PFA) overnight and embedded in paraffin according to standard procedures; 5 µm sections were cut and rehydrated for further analysis. They were either stained with Hematoxylin-Eosin or subjected to immunohistochemical analysis (IHC). For detection with primary antibodies, paraffin sections were incubated in Tris-EDTA buffer (10 mM Tris, 1 mM EDTA, 0.05% Tween 20, pH 9.0) for 20 min at 95-100°C. Then slides were washed in PBS with 0.025% Triton X-100 and blocked with 5% donkey serum and 2% BSA in PBS containing 0.1% Triton X-100 for 2 hours at room temperature. Incubation with primary antibodies was overnight at 4°C. Alexa Fluor 488- or 555-conjugated secondary antibodies diluted 1:500 were used (A-21206, A-31572, A-21202, A-31570, A-11055, A-21432, Life Technologies).
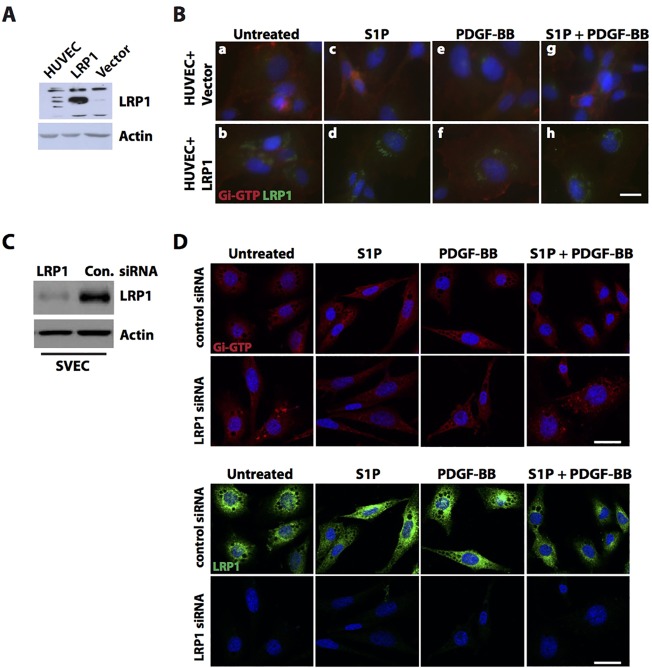
LRP1 modulates S1P signaling in endothelial cells.
(A) HUVECs, as well as Lrp1-deficient fibroblasts stably retransfected with an LRP1 expression plasmid (LRP1) or with empty plasmid vector (Vector) were cultured. Whole cell lysates were subjected to western blotting against LRP1, with actin as a loading control. (B) HUVECs transiently transfected with an LRP1 expression plasmid (HUVEC+LRP1) or with the empty plasmid vector (HUVEC+Vector) were treated with 1 µM S1P and/or with 50 ng/ml PDGF-BB for 1 min or were left untreated and Gi activation was detected by immunocytochemistry. The cells were stained for activated Gi-GTP (red) and LRP1 (green), with DAPI as counterstain. (C) SVEC4-10 cells were transfected with siRNA targeted at the mouse Lrp1 sequence (LRP1 siRNA) or firefly luciferase sequence (control siRNA). Knockdown of LRP1 was assayed by western blotting from whole cell lysates. (D) Transiently transfected SVEC4-10 cells were treated with 1 µM S1P and/or 50 ng/ml PDGF-BB for 2 min or left untreated. The cells were immunostained for Gi-GTP (red) and LRP1 (green), with DAPI counterstain. Scale bars: 10 µm in B; 20 µm in D.
Western blotting
To detect changes in cell signaling, cells were lysed in ice-cold RIPA buffer (10μM tris-HCl, 140 nM NaCl, 1 μM EDTA, 1% Triton X-100, 0.1 % sodium deoxycholate, and 0.1% SDS) containing protease cocktail inhibitor (Santa Cruz Biotechnology) and phosphatase inhibitors (10 mM NaF and 1 mM Na3OV4). Cells were lysed by sonication, cell debris was pelleted by centrifugation, and the supernatant was collected. Total protein concentrations were measured. Samples were mixed with SDS-PAGE sample buffer and boiled at 90°C for 3 min. Proteins were resolved by SDS-PAGE and transferred onto nitrocellulose membranes for detection with the appropriate antibodies. All Western blots in the figures are representative of at least three independent experiments.
Immunoprecipitation
To detect changes in GTP loading of Gαi, 1 × 10⁷ Jurkat cells were serum-starved for 6 hours and then treated as indicated in the figure legends. Cells were lysed by sonication in ice-cold immunoprecipitation lysis buffer [20 mM tris-HCl (pH 8.0), 140 nM NaCl, and 2 mM EDTA] containing protease cocktail inhibitor (Santa Cruz Biotechnology) and phosphatase inhibitors (10 mM NaF and 1 mM Na3OV4), cell debris was pelleted, and the supernatant was collected. Cell lysates were incubated with the antiactive Gαi antibody overnight at 4°C, before addition of 5 μl of protein A Dynabeads (Thermo Fisher Scientific) for 1 hour at room temperature. Immunoprecipitated proteins were eluted from the beads using SDS-PAGE loading buffer lacking dithiothreitol [50 mM tris-HCl (pH 6.8), 2% SDS, 0.1% bromophenol blue, 10% glycerol].
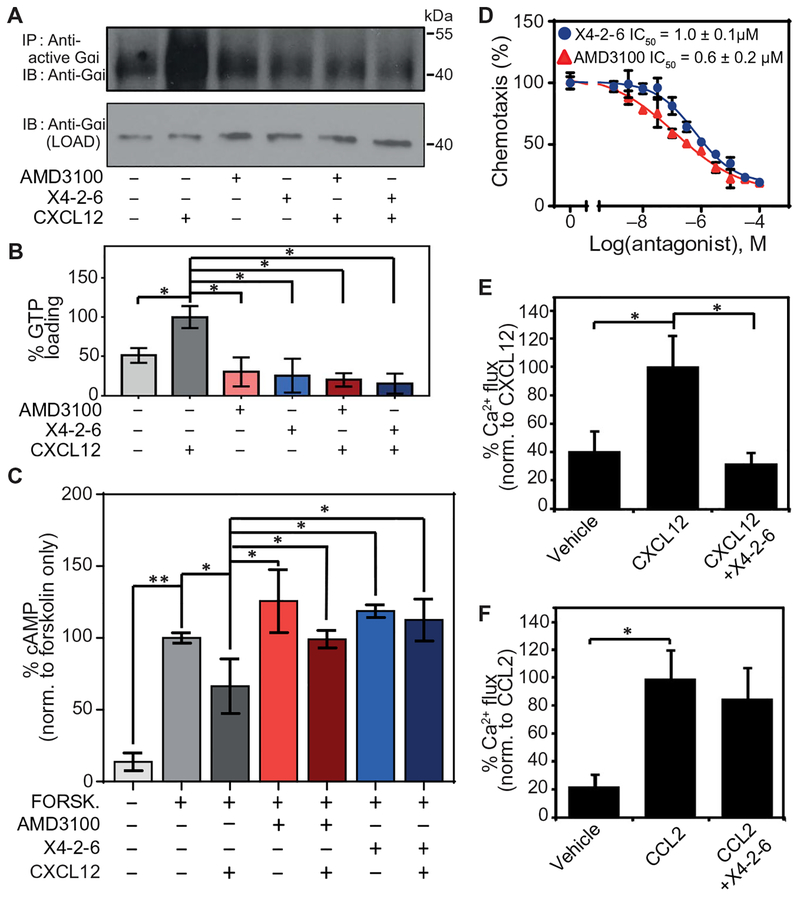
X4-2-6 specifically inhibits G protein activation downstream of CXCR4.
(A and B) Western blotting analysis for the GTP loading of Gαi in Jurkat cells pretreated with vehicle, AMD3100, or X4-2-6 and stimulated with CXCL12. (A) Blots are representative of three independent experiments. IP, immuno-precipitation; IB, immunblotting. (B) Quantified data are means ± SD from all experiments. *P < 0.01 by ANOVA. (C) Enzyme-linked immunosorbent assay (ELISA)–based analysis of the intracellular concentrations of cAMP in Jurkat cells treated as indicated. Data are means ± SD of three independent experiments with six replicates per condition. *P < 0.05 and **P < 0.005 by Student’s t test. (D) Transwell migration assay of Jurkat cell chemotaxis toward CXCL12 after treatment with AMD3100 or X4-2-6. Data are means ± SD of three independent experiments each performed in triplicate. (E) Ca2+ flux analysis in THP-1 cells treated with vehicle or X4-2-6 and stimulated with CXCL12 as indicated. Data are means ± SD from 12 biological replicates. *P ≤ 5 × 10⁻⁸ by Student’s t test. (F) Ca2+ flux analysis in THP-1 cells treated with vehicle or X4-2-6 and stimulated with CCL2 as indicated. Data are means ± SD from 12 biological replicates. *P ≤ 5 × 10⁻⁸ by Student’s t test.
IP assay
To assess the association between COMMD8 and COMMD3, mouse spleen cells or transduced 2PK-3 cells were washed with PBS and then lysed with digitonin lysis buffer (1% digitonin from Sigma-Aldrich, 0.125% NP-40, 150 mM NaCl, and 10 mM Tris-HCl, pH 7.2) containing the protease inhibitor cocktail. To assess ubiquitination of COMMD8 and COMMD3, cells were washed with PBS and then lysed with 0.5% NP-40 lysis buffer (0.5% NP-40, 150 mM NaCl, and 10 mM Tris-HCl, pH 7.2) containing the protease inhibitor cocktail and 10 mM N-ethylmaleimide (Sigma-Aldrich).
To assess the interaction of COMMD8 or COMMD3 with GPCRs or GRKs, cells were washed five times and then incubated for 30 min at 37°C in Roswell Park Memorial Institute (RPMI) medium (Wako) containing 0.5% fatty acid–free BSA (Merck Millipore). Transduced 2PK-3 cells were stimulated with CXCL12 (100 ng/ml), CXCL13 (300 ng/ml; R&D Systems), CCL19 (100 ng/ml; R&D Systems), 7α,25-HC (30 nM; Sigma-Aldrich), S1P (100 nM; Sigma-Aldrich), or clenbuterol (100 µM; Sigma-Aldrich). B cells were isolated from mouse spleens by negative selection using the AutoMACS Pro Separator and were stimulated with CXCL12 (600 ng/ml). To assess the recruitment of β-arrestin-2 to CXCR4 or β2AR, cells were washed three times and then incubated for 30 min or 2 h at 37°C in HBSS containing 10 mM Hepes, followed by stimulation with CXCL12 (100 ng/ml) or isoproterenol (1 µM). To assess site-specific phosphorylation of CXCR4 or β2AR, cells were incubated for 1–3 h at 37°C in HBSS containing 10 mM Hepes and then stimulated with CXCL12 (2PK-3 cells, 100 ng/ml; B cells, 300 ng/ml) or isoproterenol (10 µM). To assess the recruitment of GRK6 to CXCR4, cells were stimulated with CXCL12 (100 ng/ml) after incubation for 13 h at 37°C in DMEM containing 0.01% fatty acid–free BSA. After stimulation of GPCRs, cells were lysed with the digitonin lysis buffer containing protease and phosphatase inhibitor cocktails. To assess Gαi activation, cells were stimulated with CXCL12 (600 ng/ml) after incubation for 5 h at 37°C in HBSS containing 10 mM Hepes and then lysed with Triton X-100 lysis buffer (1% Triton X-100, 150 mM NaCl, 1 mM EDTA, and 50 mM Tris-HCl, pH 7.4) containing the protease inhibitor cocktail.
Cell lysates were precleared for 30 min at 4°C with protein A or G sepharose (GE Healthcare), followed by incubation for 3–5 h at 4°C with anti-Flag M2 beads (Sigma-Aldrich) or antibodies plus protein A or G sepharose. Beads were washed with lysis buffer three to five times. Samples were eluted by incubation with Flag peptides (Sigma-Aldrich) for 30 min, Myc peptides (Sigma-Aldrich) for 1 h on ice, or NuPAGE LDS Sample Buffer (Thermo Fisher Scientific) for 30 min at room temperature or 10 min at 70°C. Reduced samples were analyzed by IB as described in the method for IB analysis.
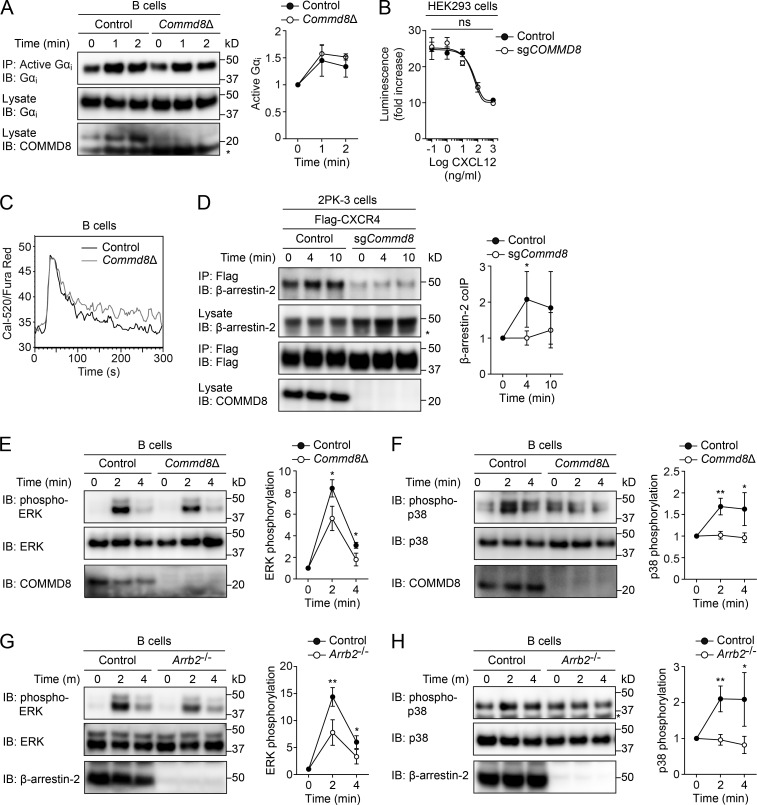
COMMD8 promotes β-arrestin–mediated signaling of CXCR4.
(A) IB analysis for Gαi activation induced by CXCL12 in control and Commd8Δ B cells. (B) CXCR4-mediated inhibition of cAMP production was assessed by the GloSensor reporter in vector-transfected control and COMMD8-deficient (sgCOMMD8) HEK293 cells expressing Flag-tagged CXCR4. The amounts of cAMP are plotted as fold increases of luminescence over the levels in unstimulated cells. Data are shown as the mean ± SD of triplicates and representative of three independent experiments. (C) Intracellular calcium responses to CXCL12 in control and Commd8Δ B cells. Responses are plotted as the ratio of Cal-520 to Fura Red fluorescence. Data are representative of two independent experiments. (D) IP assay for the recruitment of endogenous β-arrestin-2 to Flag-tagged CXCR4 in vector-transfected control and COMMD8-deficient (sgCommd8) 2PK-3 cells after stimulation with CXCL12. (E–H) IB analysis for the phosphorylation of ERK (E and G) and p38 (F and H) in Commd8Δ (E and F) and Arrb2−/− (G and H) B cells after stimulation with CXCL12. B cells from littermate Commd8f/+Mb1Cre/+ and Commd8f/fMb1+/+ (E and F) or Arrb2+/+ (G and H) mice served as the control. Error bars represent the mean ± SD of three (A and E–H) or four (D) independent experiments, and representative blots are shown. *, P < 0.05; **, P < 0.01; ns, not significant. The P values were obtained by two-tailed unpaired (A and D–H) or paired (B) t test. Asterisk indicates nonspecific bands (A, D, and H). coIP, coimmunoprecipitation.
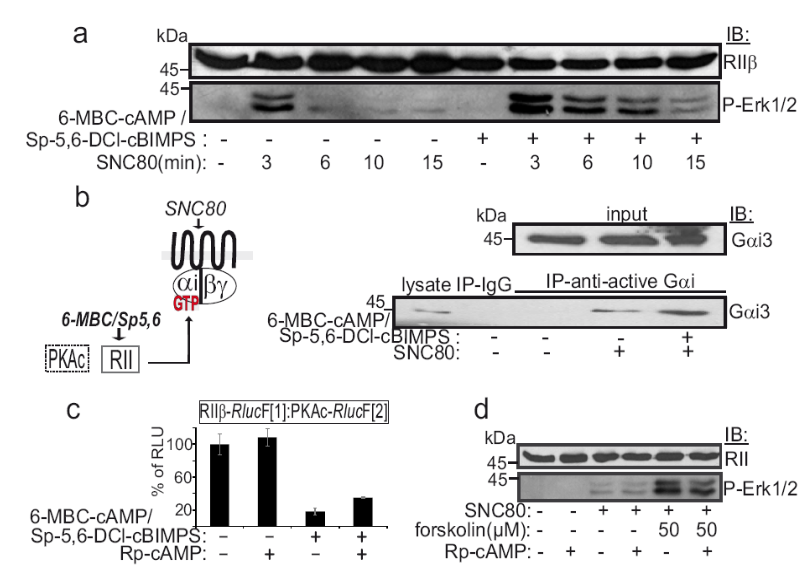
Effect of cAMP analogues on Erk1/2 phosphorylation and GTP-Gαi3 abundance.
(a) Time dependent effects of combinations of the selective δOR agonist SNC80 (1 µM) and 6-MBC-cAMP and Sp-5,6-DCl-cBIMPS (each 50 µM; 15 min) on Erk1/2 phosphorylation of δOR-HEK293 cells. Cells were pretreated for 60 minutes with KT5720 (2 µM). RII serves as loading control. (b) Following treatment of HEK293 cells stably expressing the δOR with combinations of the selective δOR agonist SNC80 (1 µM, 3 min) and 6-MBC-cAMP/Sp-5,6-DCl-cBIMPS (each 50 µM; 15 min) we prepared lysates. We precipitated GTP-bound Gαi with a monoclonal antibody specific for binding to this and not the inactive GDP-Gαi complex (1µg/precipitation, > 2mg protein; New East Biosciences). Precipitated active GTP-bound Gαi was immunoblotted with a polyclonal anti-Gαi3 antibody. The presence of RII subunit-specific cAMP analogues alone has no impact on MAPK activation as shown in Fig. 4b (representative experiment). (c) Bioluminescence was detected from HEK293T cells stably expressing the Renilla luciferase based PKA-PCA reporter in suspension aliquoted to 96-well microtiter plates. The effect of pretreatment with 250 µM of Rp-cAMP (60 minutes) and treatment with 6-MBC-cAMP/Sp-5,6-DCl-cBIMPS (each 50 µM; 15 min) on the dissociation of PKA subunits (RLU, relative light units) is shown, ±SEM from independent samples of a representative experiment. (d) Effects of combinations of δOR agonist SNC80 (3 min; 1 µM), forskolin (15 min, 50 µM) and/or Rp-cAMP pretreatment (60 minutes; 250 µM) on Erk1/2 phosphorylation of δOR-HEK293 cells; pretreatment for 60 minutes with KT5720 (2 µM); representative experiment.
Immunoprecipitation and immunoblotting
Cells were lysed in ice-cold buffer containing 0.5% Triton X-100, 50 mM HEPES (pH 7.4), 50 mM NaCl 10 mM EDTA and 1:1000 protease inhibitor cocktail III (Millipore-Sigma). Cell lysates were collected and analyzed on western blots as described (Jung et al., 2016). Bands were detected with AP-conjugated antibody and ECF reagent (GE Healthcare Biosciences, Pittsburgh, PA) on a Typhoon Trio Variable Mode Imager (GE Healthcare). For immunoprecipitation, 1 mg of protein was incubated at 4°C overnight with 1 µg of specific antibody or non-specific mouse IgG. After washing four times with lysis buffer, the protein complex was dissolved in SDS Laemmli sample buffer containing 62.5 mM Tris (pH 6.8), 2.5% SDS, 0.002% Bromophenol Blue, 10% glycerol and 5% β-mercaptoethanol. For immunoblotting, 20 μg of protein samples were loaded and analyzed on western blots as described (Jung et al., 2016). All images represent results from three independent experiments.
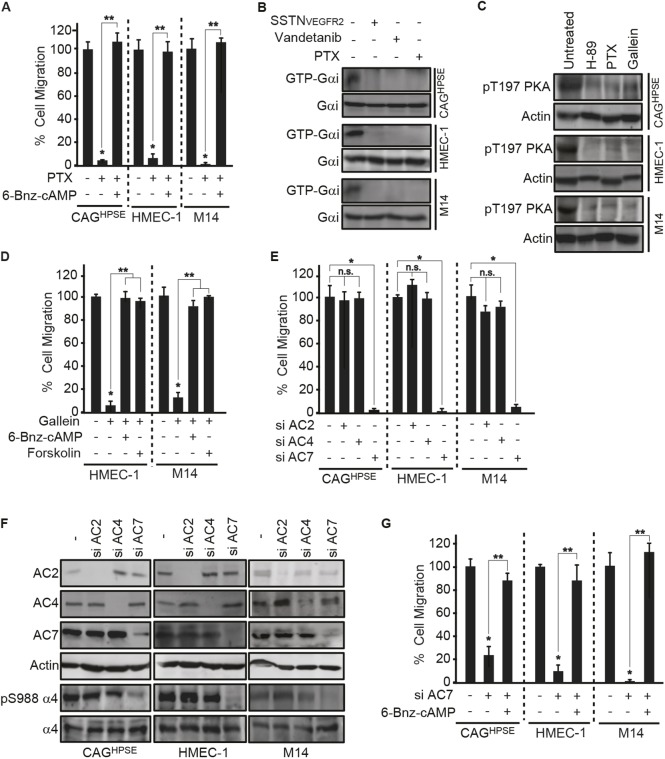
Gβγ-dependent adenylate cyclase 7 activation is required for PKA activation. (A) 16 h transfilter migration assays towards 100 µg/ml IIICS were performed with CAGHPSE, HMEC-1 or M14 cells in the absence or presence of 10 µg/ml pertussis toxin (PTX), with or without 100 µM 6-Bnz-cAMP. Migrated cells were quantified and graphed as the mean±s.d. from three independent experiments. All data were compared using the unpaired one-tailed t-test. *P<0.01 against untreated parental cells; **P<0.01 between treatments. (B) CAGHPSE, HMEC-1 or M14 cells were plated on 100 µg/ml IIICS with 30 µM SSTNVEGFR2, 10 µg/ml vandetanib or 10 µg/ml PTX for 2 h. Whole-cell lysates were subjected to immunoprecipitation with an anti-GTP-Gαi antibody and immunoblotting for Gαi. (C) CAGHPSE, HMEC-1 or M14 cells were plated on 100 µg/ml IIICS with 10 µM H-89, 10 µg/ml PTX or 20 µM gallein for 2 h. Lysates were analyzed by immunoblotting for PKA pT197 or β-actin as a loading control. (D) 16 h transfilter migration assays towards 100 µg/ml IIICS were performed with HMEC-1 or M14 cells in the absence or presence of 20 µM gallein with or without 100 µM 6-Bnz-cAMP or 30 µM forskolin. Migrated cells were quantified and graphed as the mean±s.d. from three independent experiments. All data were compared using the unpaired one-tailed t-test. *P<0.01 against untreated parental cells; **P<0.01 between treatments. (E,F) CAGHPSE, HMEC-1 or M14 cells were transfected with siRNA against AC2, AC4 or AC7 for 48 h, before performing migration and immunoblotting assays. (E) 16 h transfilter migration assays towards 100 µg/ml IIICS were performed with CAGHPSE, HMEC-1 or M14 cells. Migrated cells were quantified and graphed as the mean±s.d. from three independent experiments. All data were compared using the unpaired one-tailed t-test. *P<0.01 against untreated parental cells; n.s., not significant between treatments. (F) Cell lysates were analyzed by immunoblotting for AC2, AC4, AC7, α4 integrin, α4-pS988 and β-actin as a loading control. (G) CAGHPSE, HMEC-1 or M14 cells were transfected with or without AC7 siRNA for 48 h and then 16 h transfilter cell migration assays towards 100 µg/ml IIICS were performed in the absence or presence of 100 µM 6-Bnz-cAMP. Migrated cells were quantified and graphed as the mean±s.d. from three independent experiments. All data were compared using the unpaired one-tailed t-test. *P<0.01 against untreated parental cells; **P<0.01 between treatments.
Immunoprecipitation and immunoblotting
Cells were lysed in ice-cold buffer containing 0.5% Triton X-100, 50 mM HEPES (pH 7.4), 50 mM NaCl 10 mM EDTA and 1:1000 protease inhibitor cocktail III (Millipore-Sigma). Cell lysates were collected and analyzed on western blots as described (Jung et al., 2016). Bands were detected with AP-conjugated antibody and ECF reagent (GE Healthcare Biosciences, Pittsburgh, PA) on a Typhoon Trio Variable Mode Imager (GE Healthcare). For immunoprecipitation, 1 mg of protein was incubated at 4°C overnight with 1 µg of specific antibody or non-specific mouse IgG. After washing four times with lysis buffer, the protein complex was dissolved in SDS Laemmli sample buffer containing 62.5 mM Tris (pH 6.8), 2.5% SDS, 0.002% Bromophenol Blue, 10% glycerol and 5% β-mercaptoethanol. For immunoblotting, 20 μg of protein samples were loaded and analyzed on western blots as described (Jung et al., 2016). All images represent results from three independent experiments.
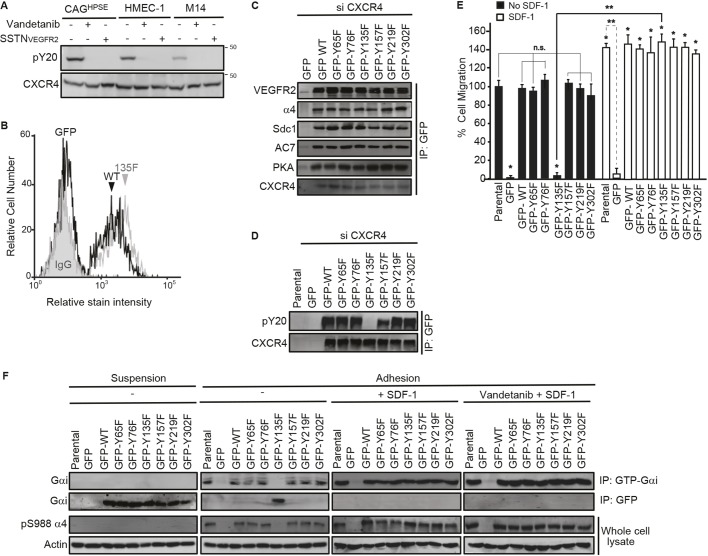
VEGFR2 activates CXCR4 by phosphorylating Y135 in its DRY motif. (A) CAGHPSE, HMEC-1 or M14 cells were plated on 100 µg/ml IIICS in the absence or presence of 10 µM vandetanib or 30 µM SSTNVEGFR2 for 2.5 h. CXCR4 was immunoprecipitated with rabbit anti-CXCR4 antibody and the CXCR4-containing complexes were analyzed by immunoblotting with anti-phosphotyrosine or rat anti-CXCR4 antibody. (B–F) CAGHPSE, HMEC-1 or M14 cells were co-transfected with CXCR4 3′UTR siRNA and CXCR4 cDNA lacking the 3′UTR (GFP-tagged WT and Y→F mutants or GFP alone) for 48 h. The cells were then analyzed by flow cytometry, immunoprecipitation and migration assays. (B) GFP-tagged WT or Y135F CXCR4 mutant HMEC-1 cells were incubated with PBS alone or 200 nM SDF-1 in PBS at 4°C. After incubation with 10 µg/ml anti-SDF-1 antibody versus an isotype-matched control mouse IgG1 for 1 h, cells were fixed and blocked with 3% BSA in PBS. The bound antibody was detected with a RPE-labeled anti-mouse IgG and analyzed by flow cytometry for SDF-1-bound CXCR4. (C) CAGHPSE cell lysates were subjected to immunoprecipitation with anti-GFP antibody and then analyzed with anti-VEGFR2, anti-α4 integrin, anti-hSdc1, anti-AC7, anti-PKA or anti-CXCR4 antibodies. (D) M14 cell lysates were subjected to immunoprecipitation with anti-GFP antibody and then analyzed with anti-phosphotyrosine (pY20) or anti-CXCR4 antibodies. (E) Quantification of 16 h transfilter migration of CAGHPSE cells towards 100 µg/ml IIICS in the absence or presence of 20 nM SDF-1 is plotted as the mean±s.d. of three independent experiments. All data were compared using the unpaired one-tailed t-test. *P<0.01 against untreated parental cells; **P<0.01, n.s., not significant between treatments. (F) CAGHPSE cells were kept in suspension or plated on 100 µg/ml IIICS in the absence or presence of 20 nM SDF-1 with or without 10 µM vandetanib for 2 h. Cell lysates were subjected to immunoprecipitation with anti-GFP or anti-GTP-Gαi antibodies, then probed with anti-Gαi antibody. The whole-cell lysates were analyzed by immunoblotting for integrin α4-pS988 and β-actin.
Immunoprecipitation and immunoblotting
Cells were lysed in ice-cold buffer containing 0.5% Triton X-100, 50 mM HEPES (pH 7.4), 50 mM NaCl 10 mM EDTA and 1:1000 protease inhibitor cocktail III (Millipore-Sigma). Cell lysates were collected and analyzed on western blots as described (Jung et al., 2016). Bands were detected with AP-conjugated antibody and ECF reagent (GE Healthcare Biosciences, Pittsburgh, PA) on a Typhoon Trio Variable Mode Imager (GE Healthcare). For immunoprecipitation, 1 mg of protein was incubated at 4°C overnight with 1 µg of specific antibody or non-specific mouse IgG. After washing four times with lysis buffer, the protein complex was dissolved in SDS Laemmli sample buffer containing 62.5 mM Tris (pH 6.8), 2.5% SDS, 0.002% Bromophenol Blue, 10% glycerol and 5% β-mercaptoethanol. For immunoblotting, 20 μg of protein samples were loaded and analyzed on western blots as described (Jung et al., 2016). All images represent results from three independent experiments.
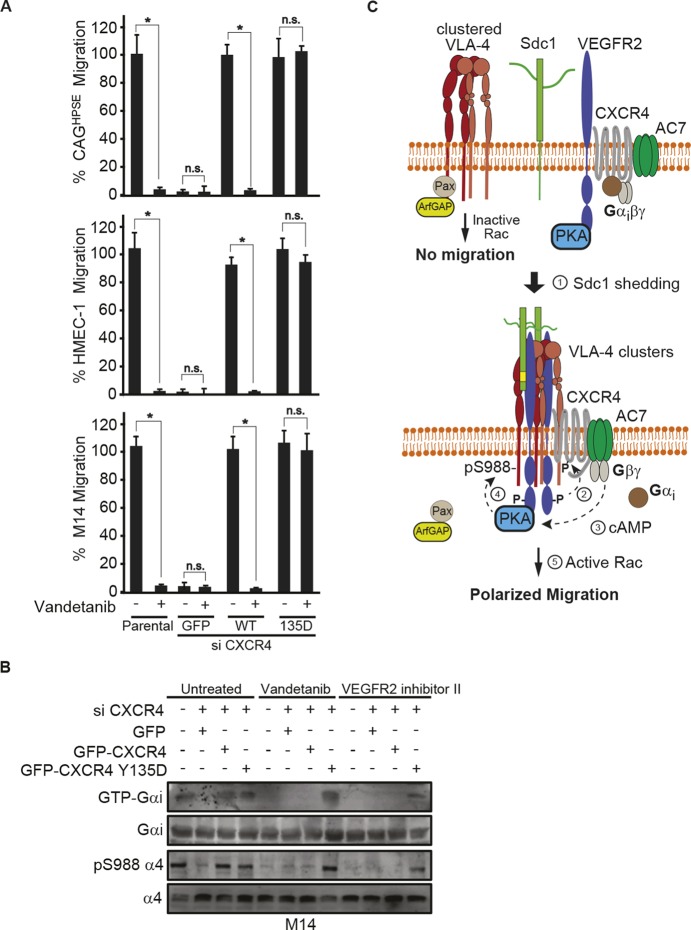
The CXCR4 Y135D phosphomimetic mutant rescues the effects of VEGFR2 inhibition. (A,B) CAGHPSE, HMEC-1 or M14 cells were transfected with GFP alone, GFP–CXCR4 WT, or GFP–CXCR4 Y135D together with siRNA targeting 3′UTR of endogenous CXCR4 for 48 h. (A) 16 h transfilter cell migration assay towards 100 µg/ml IIICS was performed in the absence or presence of 10 µM vandetanib. Migrated cells were quantified and graphed as the mean±s.d. from three independent experiments. All data were compared using the unpaired one-tailed t-test. *P<0.01, n.s., not significant. (B) M14 cell lysates were subjected to immunoprecipitation with anti-GTP-Gαi and probed for Gαi. Whole-cell lysates were analyzed by immunoblotting for Gαi or α4 integrin (total or pS988). (C) Model depicting how paxillin bound to VLA-4 causes inherent inhibition of Rac GTPase at this site due to its binding of ArfGAP (Nishiya et al., 2005). VEGFR2 forms a complex with CXCR4, AC7 and PKA, but this complex is inactive unless Sdc1 is shed. Trimming of the HS chains on Sdc1 by HPSE facilitates its shedding by MMP9 (Purushothaman et al., 2010; Yang et al., 2007). Sdc1 freed of its membrane anchorage couples VEGFR2 and its integrin phosphorylation machinery to VLA-4 clusters. VEGFR2 activated by this clustering event phosphorylates CXCR4 at Y135, activating its heterotrimeric G-protein. Gβγ freed of Gαi activates AC7, generating cAMP that activates PKA. PKA phosphorylation of the α4 integrin cytoplasmic domain at S988 dissociates paxillin–ArfGAP from VLA-4, allowing local lamellipodium formation and directed cell migration.
G protein activation assay
For immunoprecipitation of active Gαi3, freshly prepared cell lysates (2–4 mg) were incubated for 30 min at 4°C with the conformational Gαi3:GTP mouse antibody (1 μg)84 or pre-immune control mouse IgG. Protein G Sepharose beads (GE Healthcare) were added and incubated at 4°C for additional 30 min (total duration of assay is 1 h). Beads were immediately washed 3 times using 1 mL of lysis buffer (composition exactly as above; no nucleotides added) and immune complexes were eluted by boiling in SDS as previously described. Previous work from our lab validated the use of this antibody to selectively immunoprecipitate His-Gαi3 recombinant proteins loaded with GTP (physiologic active conformation that is transient) and GTPϒS (non-hydrolysable nucleotide mimicking a stable active conformation) but not GDP (inactive conformation).
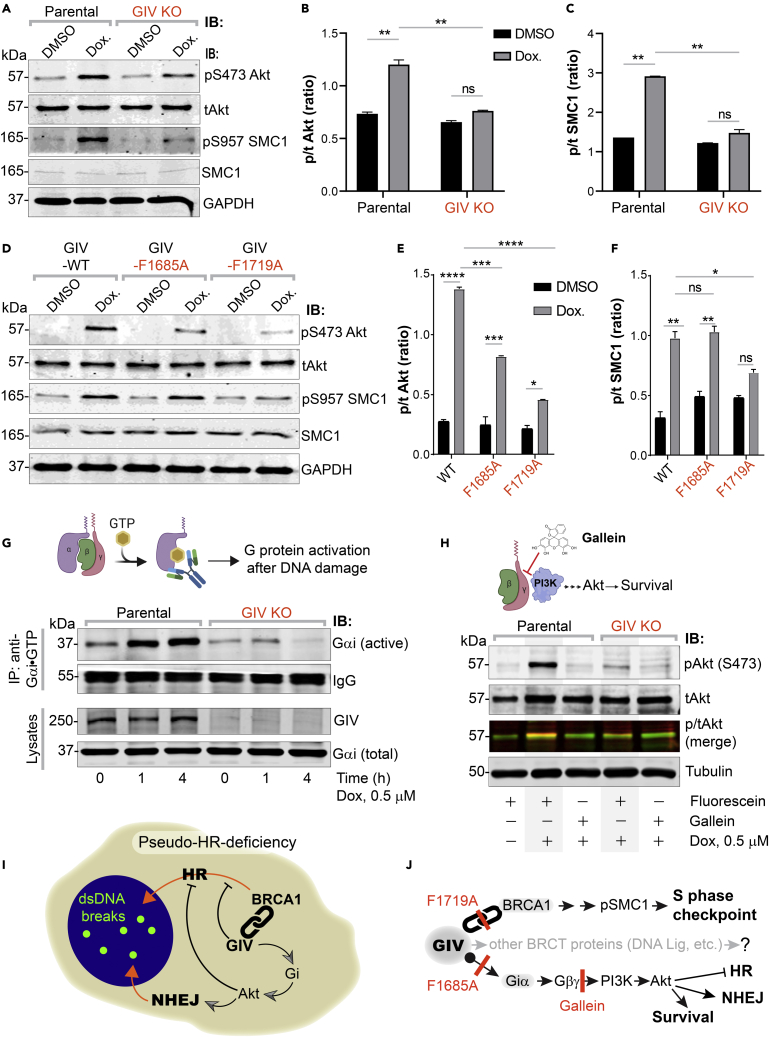
Activation of Gi by GIV is required for Akt enhancement during DDR, contributes to pseudo-HR-deficiency
(A–F) Control (parental) and GIV-depleted (GIV KO) HeLa cells (A-C) or GIV-depleted cells stably expressing WT or mutant GIV constructs (D-F) were challenged with Dox or vehicle control (DMSO) as indicated prior to lysis. Equal aliquots of lysates were analyzed for total (t) and phosphorylated (p) Akt and SMC1 proteins and GAPDH (loading control) by quantitative immunoblotting using LiCOR Odyssey. Representative immunoblots are shown in A and D, and quantification of phospho(p)/total(t) proteins is displayed as bar graphs in B, C, E, F. Data displayed as mean ± SEM and one-way ANOVA to determine significance. (∗; p ≤ 0.05; ∗∗; p ≤ 0.01; ∗∗∗; p ≤ 0.001; ∗∗∗∗; p ≤ 0.0001; ns = not significant).
(G) Schematic on top shows the assay used for assessing the extent of Gαi-activation using conformation-sensitive antibodies that selectively bind the GTP-bound (active) conformation of Gαi protein. Immunoblots below show the active Gαi immunoprecipitated (top; IP) from lysates (bottom) of HeLa cells treated with Dox. for the indicated time points.
(H) GIV-depleted (GIV KO) and control (Parental) HeLa cells were stimulated (+) or not (−) with Dox. as indicated, in the presence of either Gallein or its inactive isomer, Fluorescein. Equal aliquots of lysates were immunoblotted for pAkt and tAkt as in panel A.
(I and J) Summary of findings showing how GIV skews the choice of repair pathway from HR to NHEJ, partly via sequestration of BRCA1 away from the sites of dsDNA breaks and in part via the enhancement of Akt via the Gi→“free” Gβγ→Class I PI3K pathway. The tools (mutants and chemical inhibitors) used in this work are highlighted in red.
2.2 Cell culture and immunoprecipitation
RAW 264.7 cells were grown in Dulbecco’s modified Eagle’s medium (Gibco Invitrogen Corporation, Carlsbad, CA) supplemented with heat inactivated 10% fetal bovine serum (Cellgro Mediatech Inc., Herndon, VA), 2% Penicillin/streptomycin (BioWhittaker Inc., Walkersville, MD) in 150 cm2 tissue culture flasks and maintained at 37°C in 5% CO2, 95% air. The confluent cells were detached using 0.05% trypsin-EDTA (Gibco Invitrogen Corporation, Carlsbad, CA) and passaged every 2–3 days. RAW 264.7 cells within 20 passages were used for experiments.
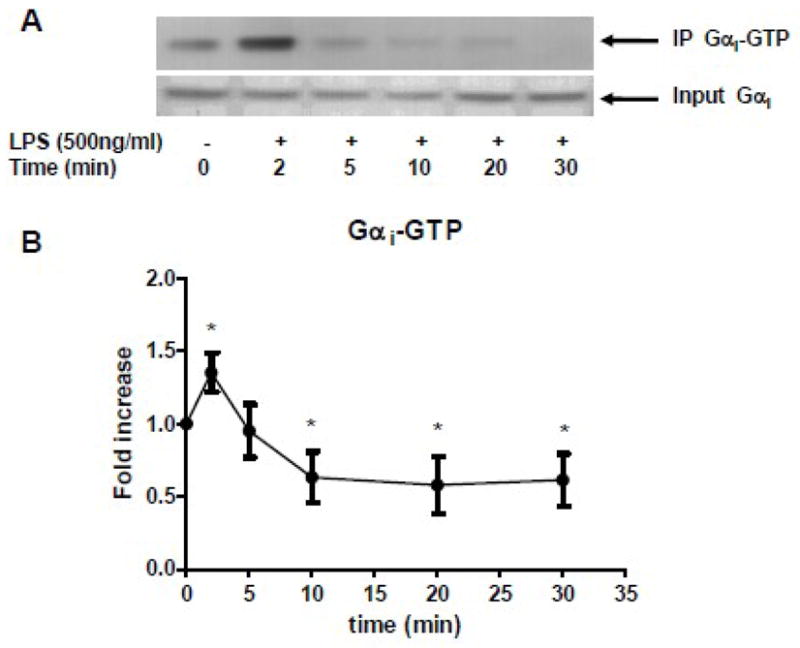
RAW 264.7 cells were stimulated with LPS (500ng/ml, ultra pure LPS from Escherichia coli O111:B4, List Laboratories, Campbell, CA) for various periods of time. Activated Gαi protein was immunoprecipitated with a Gαi protein activation assay kit (New East Biosciences, Malvern PA). Briefly, cells were lysed with lysis buffer provided in the kit and Gαi-GTP complex was immunoprecipitated with an antibody that specifically bound to the Gαi-GTP complex. The immunoprecipitated proteins were subjected to Western blot with anti-Gαi protein antibody.
LPS modulated Gαi proteins activation
RAW 264.7 cells were stimulated with LPS (500ng/ml). (A) Gαi-GTP complex was immunoprecipitated and subjected to Western blot (top gel). The total Gαi proteins were shown in bottom gel. (B) The statistical analysis was performed on densitometry scan. Data are representative of seven independent experiments. *, p<0.05 compared to basal group.
Cell culture, transfection, lysis, and immunoprecipitation
For immunoprecipitation of active Gαi3, freshly prepared cell lysates (2-4 mg) were incubated for 30 min at 4°C with the conformational Gαi3:GTP mouse antibody (1 μg; Lane et al., 2008) or preimmune control mouse IgG. Protein G-Sepharose beads (GE Healthcare) were added and incubated at 4°C for additional 30 min (total duration of assay is 1 h). Beads were immediately washed three times using 1 ml of lysis buffer (composition exactly as before; no nucleotides added), and immune complexes were eluted by boiling in SDS as previously described (Ghosh et al., 2010).
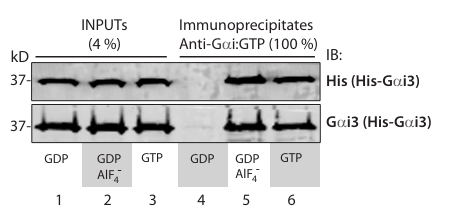
Anti-Gαi:GTP antibody recognizes Gαi3 in active conformation in immunoprecipitation assays.
Equal aliquots of purified His-Gai3 (3 ug) was first incubated with either 30 uM GDP, or 100 uM GTP, or 30 uM GDP and Aluminum fluoride (AlF) for 1 hour at 30C prior to incubation with 1 ug of anti-Gi:GTP mAb at 4C for 30 min, followed by protein G beads for another 30 min. Immune complexes were analyzed for bound (i.e., active conformation) His-Gai3 protein by immunoblotting with His mAb (top) and Gai3 pAb (bottom). Active Gai3 was only detected when the G protein was incubated with GTP or GDP/AlF4- , but not when incubated with with GDP alone.
Cell culture, transfection, lysis, and immunoprecipitation
For immunoprecipitation of active Gαi3, freshly prepared cell lysates (2-4 mg) were incubated for 30 min at 4°C with the conformational Gαi3:GTP mouse antibody (1 μg; Lane et al., 2008) or preimmune control mouse IgG. Protein G-Sepharose beads (GE Healthcare) were added and incubated at 4°C for additional 30 min (total duration of assay is 1 h). Beads were immediately washed three times using 1 ml of lysis buffer (composition exactly as before; no nucleotides added), and immune complexes were eluted by boiling in SDS as previously described (Ghosh et al., 2010).
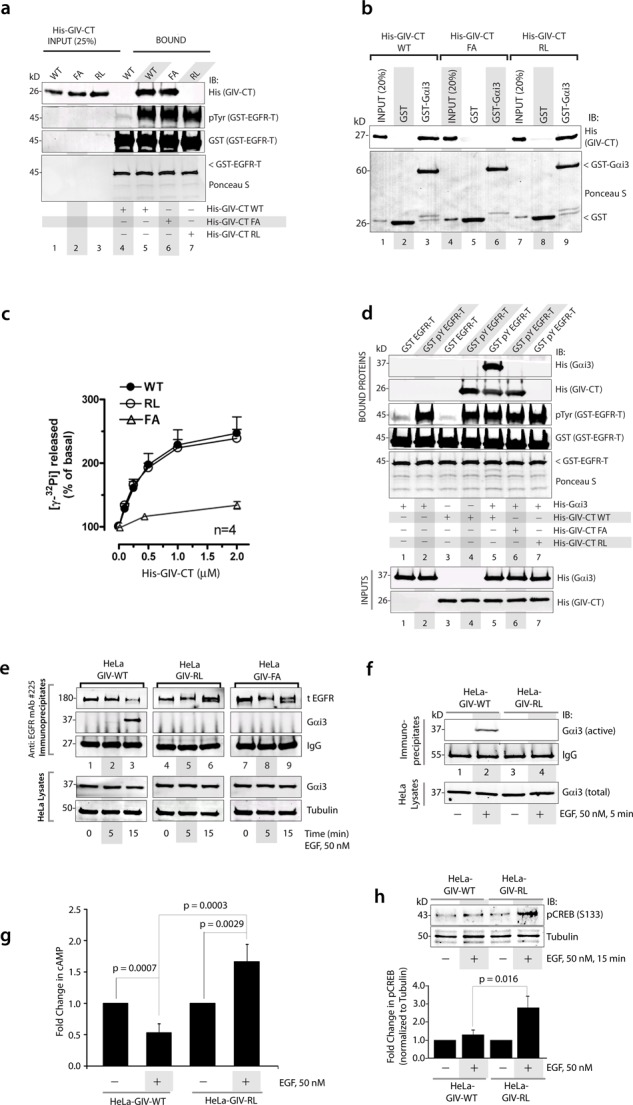
GIV’s SH2 and GEF domains are required for the recruitment of Gαi3 to ligand-activated EGFR and activation of G protein after EGF stimulation. (a) Equal aliquots (15 μg) of GST-EGFR-T (aa 1064–1210) were either phosphorylated in vitro using 5 ng of recombinant EGFR kinase (GST-pY EGFR-T; lanes 5–7) or mock treated (GST-EGFR-T; lane 4) and subsequently used in pull-down assays with equal amounts of purified WT, FA (GEF-deficient), or RL (SH2-deficient) mutants of His-GIV-CT (aa 1660–1870; lanes 1–3, inputs). Bound proteins were analyzed for His-GIV-CT and phosphorylation of GST-EGFR-T by IB. As anticipated, GST-pY EGFR-T (lane 5) but not GST-EGFR-T (lane 4) directly binds His-GIV-CT WT. The FA (lane 6) but not RL (lane 7) mutant of GIV-CT binds GST-pY EGFR-T. (b) WT, FA, and RL mutants of His-GIV-CT were incubated with 5 μg of GST-Gαi3 or GST preloaded with GDP immobilized on glutathione beads. Bound proteins were analyzed by IB for GIV-CT using anti-His mAb. His-GIV-CT WT (lane 3) and RL mutant (lane 9) bound GST-Gαi3 equally, and, as anticipated, the FA mutant did not (lane 6). (c) The amount of GTP hydrolyzed in 10 min by His-Gαi3 was determined in the presence of the indicated amounts of WT (∆), FA (Δ), and RL mutant (•) His-GIV-CT. Both WT and RL mutants increased the steady-state GTPase activity of His-Gαi3 efficiently and equally in a dose-dependent manner, whereas the FA mutant did not. The basal steady-state GTPase activity of His-Gαi3 is 0.021 ± 0.04 mol Pi mol Gαi3−1 min−1 and the results are displayed as percentage of basal activity. (d) Equal aliquots (15 μg) of GST-EGFR-T (aa 1064–1210) were either phosphorylated in vitro with recombinant EGFR kinase (GST-pY EGFR-T; lanes 2 and 4–7) or mock treated (GST-EGFR-T; lanes 1 and 3) and subsequently used in pull-down assays with purified His-Gαi3 alone (lanes 1 and 2), His-GIV-CT alone (lanes 3 and 4), or a mix of His-Gαi3 and WT, FA, or RL mutants of His-GIV-CT as indicated. Bound proteins were analyzed for His-GIV-CT and phosphorylation of GST-EGFR-T by IB. Gαi3 binds GST-pY EGFR in the presence of WT (lane 5) but not FA (lane 6) or RL (lane 7). (e) HeLa GIV-WT, HeLa GIV-FA, and HeLa GIV-RL cells stably expressing the indicated siRNA-resistant GIV constructs were depleted of endogenous GIV by siRNA, serum starved for 16 h, and then stimulated with EGF for the indicated durations before lysis. Equal aliquots of lysates (bottom) were incubated with anti-EGFR mAb (#225 IgG). Immune complexes (top) were analyzed for total (t-EGFR) and Gαi3 by IB. (f) Equal aliquots of lysates (bottom) from starved or EGF-treated HeLa GIV-WT and GIV-RL cells were incubated with anti-Gαi:GTP mAb. Immune complexes (top) were analyzed for Gαi3 by IB. (g) HeLa-GIV-WT and GIV-RL cells were depleted of endogenous GIV as in e, serum starved (0.2% FBS), and subsequently stimulated with EGF and analyzed for cAMP by RIA (see Materials and Methods). Results are displayed as fold change in cAMP (y-axis) in each cell line normalized to their respective starved state. (h) HeLa-GIV-WT and GIV-RL cells were stimulated with EGF before lysis as in e. Top, equal aliquots of whole-cell lysates were analyzed for phosphorylated CREB (pCREB) and tubulin by IB. Bottom, bar graphs display the quantification of pCREB/tubulin by band densitometry. All values are normalized to the starved HeLa-GIV-WT cells. Results are shown as mean ± SEM; n = 3.
Immunoprecipitation and Gαi activation assay.
Cell lysates extracted using radioimmunoprecipitation assay buffer (RIPA) containing protease and phosphatase inhibitor cocktails were incubated with the appropriate antibody and subsequently incubated with protein A/G beads. Beads were washed three times with RIPA buffer and underwent Western blot analysis with the primary antibodies and with an HRP-conjugated secondary antibody. Blots were visualized by enhanced chemiluminescence (GE Health, Berne, Switzerland). For Gαi activation assay, we used the Gαi Activation Assay Kit (NewEast Biosciences, Malvern, PA) as previously described (21). Cells treated with or without ACEA were lysed with ice-cold 1×Assay/Lysis buffer and underwent immunoprecipitation with anti-Gαi–guanosine triphosphate (GTP) antibody and Western blot analysis with anti-Gαi3 antibody. For positive control, β-IRWT cell lysate, not treated with ACEA, was incubated with guanosine 5′-O-[γ-thio] triphosphate (GTP-γS) for 90 min before immunoprecipitation.
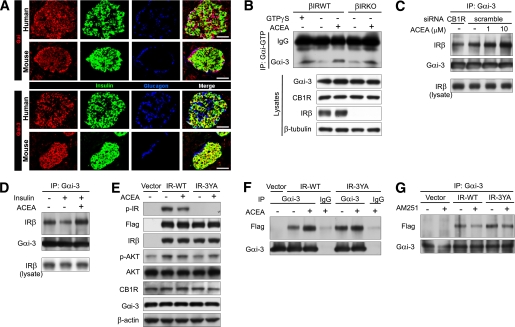
Activation of CB1Rs increases the association between Gαi3 and IR.
A: Immunostaining for Gαi and Gαi3 in human and mouse islets. Anti-Gαi antibody recognizes Gαi1, Gαi2, and Gαi3. Scale bar = 50 μm. B: Gαi activation assay in β-IRWT and β-IRKO cells. Lysates of β-IRWT and β-IRKO cells treated with or without ACEA (10 μmol/L) for 20 min were subjected to immunoprecipitation with anti-Gαi-GTP and to immunoblotting with anti-Gαi3. For positive control, β-IRWT cell lysate not treated with ACEA was incubated with GTP-γS for 90 min before immunoprecipitation. C: Endogenous Gαi3/IR interaction in β-IRWT cells exposed to ACEA or vehicle (15 min) after transfection of the indicated siRNAs. D: Endogenous Gαi3/IR interaction in β-IRWT cells exposed to insulin (10 nmol/L) with or without ACEA (10 μmol/L). E: Western blot analysis for the indicated proteins in β-IRKO cells exposed to ACEA (10 μmol/L) for 15 min after transfection with empty vector, IR-WT, or IR-3YA. F: Increase of Gαi3/IR interaction by ACEA in β-IRKO cells of cohorts in E. G: Reduction of Gαi3/IR interaction by AM251 in β-IRKO cells transfected with empty vector, IR-WT, or IR-3YA. (A high-quality digital representation of this figure is available in the online issue.)
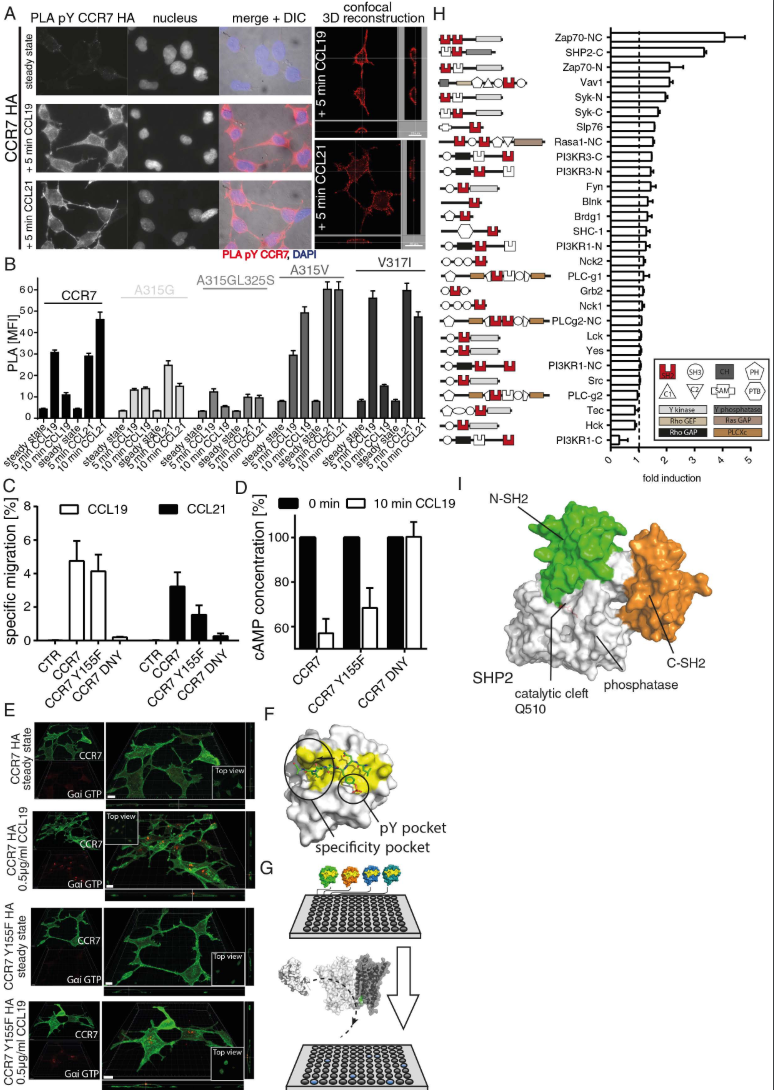
Src phosphorylates oligomeric CCR7 on Y155 to control cell migration through recruitment of SH2 domain containing proteins, related to Figure 5.
(A) Tyrosine phosphorylation of CCR7 upon ligand binding. HEK293 cells stably expressing HA-tagged CCR7 were stimulated or not with 0.5μg/ml CCL19 or CCL21 and pTyr of CCR7 was determined by PLA using anti-CCR7 (SAB4500329) and anti-phosphoTyr (clone 4G10) specific antibodies. One representative experiment out of 4 is shown. (B) Src preferentially tyrosine phosphorylates oligomeric CCR7. HEK293 cells expressing either wild-type CCR7 or oligomer-defective or super-oligomerizing CCR7 mutants were stimulated or not with 0.5 μg/ml CCL19 or CCL21 for 5 or 10 min. CCR7 pTyr was assessed by PLA, visualized by fluorescent microscopy and mean fluorescence intensities +/- SEM of 3 independent experiments were quantified by ImageJ. (C) Cell migration towards CCL19 and CCL21 in 3D is hampered in cells expressing a phosphorylation-defective mutant (CCR7 Y155F) and abolished by a G-protein-coupling-deficient mutant (CCR7 DNY). Specific cell migration of 300-19 CCR7 transfectants in response to 0.5g/ml CCL19 or CCL21 was determined in 3D Matrigel migration assays. Mean values ± SEM, n=3. (D,E) G-protein coupling is not affected in the CCR7 Y155F mutant. G-protein activation in HEK293 cells expressing CCR7 variants was assessed using a cAMP competition ELISA (D; mean values +/-SEM, n=3) or visualized by confocal microscopy using an antibody specifically recognizing active, GTP-bound Gαi (E; one of 3 experiments). Scale bars: 10μm. (F) Interphase of the phosphopeptide (green) with SHP2 N-SH2 (PDB 3TL0) showing the typical position of the pY binding and specificity pocket (yellow) of the SH2 domain. (G) Schematic representation of the ELISA-based SH2-domain interaction screen. SH2-domains of distinct signaling molecules fused to GST were coated on microtiter plates. Cell lysates containing v-Src-driven tyrosine phosphorylated CCR7 or nontransfected control lysates were used to screen for interactions with the coated SH2-domains as specified in the method section of the supplement. (H) Schematic representation of the SH2- domain (highlighted in red) bearing signaling molecules used for the screen and their interaction with pTyr CCR7. Background signals obtained from cell lysates incubated on GST-coated plates were subtracted and the ratio of nontransfected to v-Src transfected HEK293 cells stably transfected with CCR7 was calculated and indicated as fold induction. Mean values +/- SEM of triplicates of 2 experiments are shown. (I) Surface representation of autoinhibited SHP2 based on its crystal structure (PDB 2SHP) with the two SH2 domains highlighted in green and orange, the phosphatase domain in white.
Gαi activation assay
Gαi activation assay was performed on MCF7 cells according to the manufacturer’s protocol. Briefly, cell lysates from 3D cell culture were incubated with an anti-active Gαi antibody (1:1000). The precipitated active Gαi was immunoblotted with an anti- Gαi antibody (1:1000). Bound antibodies were revealed with HRP-conjugated secondary antibodies (1:2000) using SuperSignal West pico chemiluminescent solution (Pierce, Rockford, IL). Protein amount was normalized to β–tubulin. Membranes were scanned and the densitometric analysis of the bands was performed using the ChemiDoc MP imaging system.
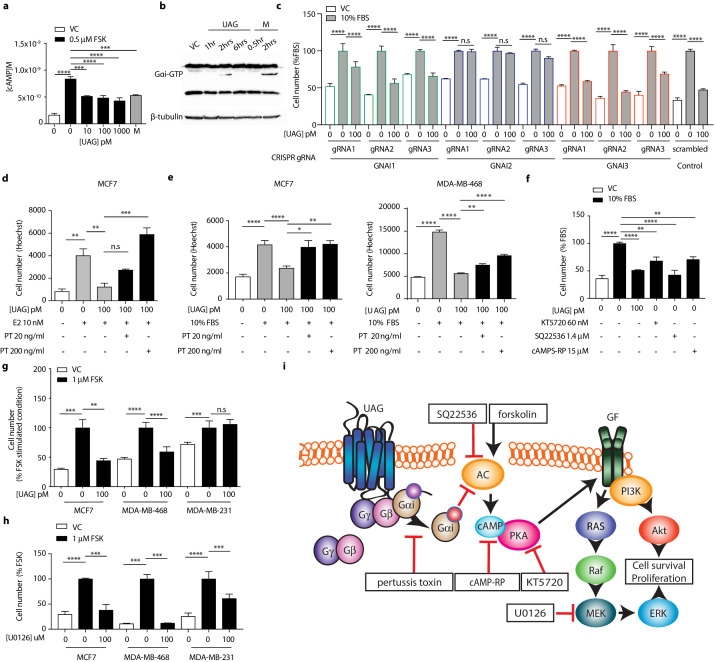
Unacylated ghrelin suppresses breast cancer cell growth via Gαi-dependent inhibition of cAMP formation.
(a) Unacylated ghrelin (UAG; 10–1000 pM) inhibits the forskolin-stimulated production of cAMP in MCF7 cells (3–4 replicates/group). (b) UAG (100 pM) stimulates activation of Gαi (three replicates/group). (c) UAG (100 pM) suppresses the growth of CRISPR GNAI1 and GNAI3 KO cells, but not GNAI2 KO MCF7 cells, suggesting Gαi2-coupled GPCR-mediated effects. Suppression of (d) estradiol- or (e) serum-stimulated breast cancer cell growth with UAG (100 pM) is prevented in the presence of Gαi inhibitor, pertussis toxin (20 ng/ml, 200 ng/ml; three replicates/group). (f) PKA inhibitor (KT5720), adenylyl cyclase inhibitor (SQ22536) or cAMP antagonist (cAMPS-RP) suppress the serum-stimulated growth of MCF7 cells (three replicates/group). (g) UAG (100 pM) inhibits the forskolin-stimulated growth of MCF7 and MDA-MB-468 cells, but not MDA-MB-231 (three replicates/group). (h) U0126 (MEK inhibitor) inhibits the forskolin-stimulated growth of MCF7, MDA-MB-468 and MDA-MB-231 cells (three replicates/group). (i) A model summarizing the putative mechanism of action of UAG in breast cancer cells and compounds used to dissect mechanism of action. Data represent mean ± SEM. Experiments were repeated at least twice. UAG: unacylated ghrelin; VC: vehicle control; FBS: fetal bovine serum; E2: estradiol; PT: pertussis toxin; M: melatonin; FSK: forskolin.
4.4. Immunoprecipitation of Active Gαi
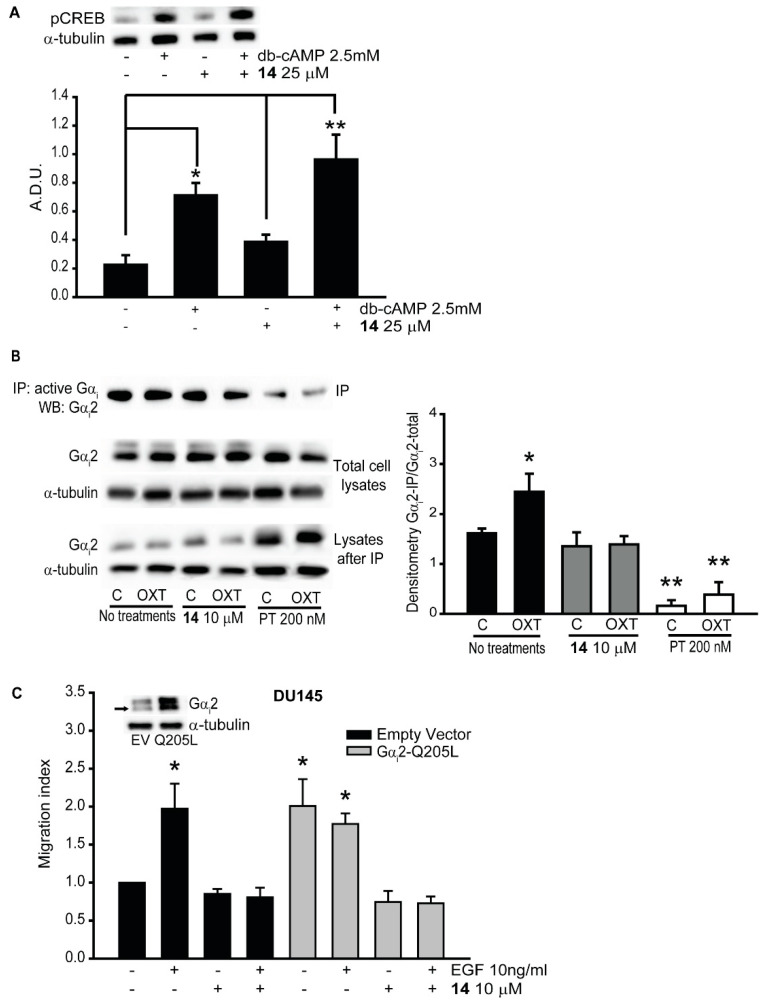
PC3 cells (3 × 10⁶ cell/dish) were incubated with or without inhibitor 14 (10 μM) for 30 min and then treated with EGF (10 ng/mL) and OXT (200 nM) for additional 30 min. Cells were lysed in ice-cold cell lysis buffer (Cell Signaling Technology, Danvers, MA, USA), and snap-frozen in liquid nitrogen. Total cell lysates, containing approximately 1000 μg of proteins, were used for immunoprecipitation using procedures described previously [41]. Briefly, lysates were incubated with 1 μg of anti-active Gαi antibody, overnight at 4 °C. Immunocomplexes were collected by centrifugation after incubation with protein A/G-Sepharose beads for 48 h (Santa Cruz Biotechnology, Dallas, TX, USA), and were analyzed by Western blot analysis with specific anti-Gαi2 antibody (1:5000 dilution, ab157204, Abcam, Cambridge, MA, USA).
The inhibitors blocked the activation of Gαi2.
(A) PC3 cells were pre-treated with (+) or without (−) compound 14 at 25 μM and then stimulated with (+) or without (−) dibutyryl-cAMP (dbcAMP) at 2.5 mM. Total cell lysates were subjected to Western blot analysis, using the pCREB (Ser129) antibody. Independent experiments were conducted at least three times, and representative images of immunoblots are shown. Densitometr analysis was performed using ImageJ [24]. (B) Total cell lysates from different treatments were immunoprecipitated using anti-active Gαi antibody, and the immunoprecipitates were immunoblotted with anti-Gαi2 antibody. Independent experiments were conducted three times, and representative images of immunoblots are shown. Densitometric analysis was performed using ImageJ [24]. (C) Cell migrations in parental DU145-EV and DU145-Gαi2-Q205L cells were performed after incubation with (+) or without (−) compound 14 at 10 μM, in presence (+) or absence (−) of EGF (10 ng/mL). Results are expressed as migration index. Each bar represents mean ± SEM (* p ≤ 0.05; ** p ≤ 0.01).
Immunoblotting and immunoprecipitation
Following stimulation, cells were scraped in 1% NP-40 lysis buffer (20 mM Tris, pH 7.4, 137 mM NaCl, 20% glycerol, 1% Nonidet P-40, 2 mM sodium orthovanadate, 1 mM PMSF, 10 mM sodium fluoride, 10 μg per ml aprotinin, 5 μg per ml leupeptin and phosphatase inhibitors) or 1% DDM lysis buffer (20 mM HEPES, 150 mM NaCl, 1% n-Dodecyl β-d-maltoside, protease inhibitors and phosphatase inhibitors). For immunoprecipitation of FLAG-tagged β1AR or β2AR, 1–2 mg of protein was incubated overnight with 30 μl of anti-FLAG M2 magnetic beads (Sigma). For immunoprecipitation of active Gαi, protein was incubated for 2 h with anti-active Gαi antibody (New East Biosciences) and Protein A/G beads (EMD Millipore). Immunoprecipitates or cell lysate samples were separated by SDS-PAGE, transferred to PVDF membrane (Bio-Rad) and subjected to immunoblotting with various primary antibodies. Immunoblots were detected using enhanced chemiluminescence (Thermo Fisher Scientific) and analyzed with ImageJ software. Uncropped blots are shown in Supplementary Fig. 6.
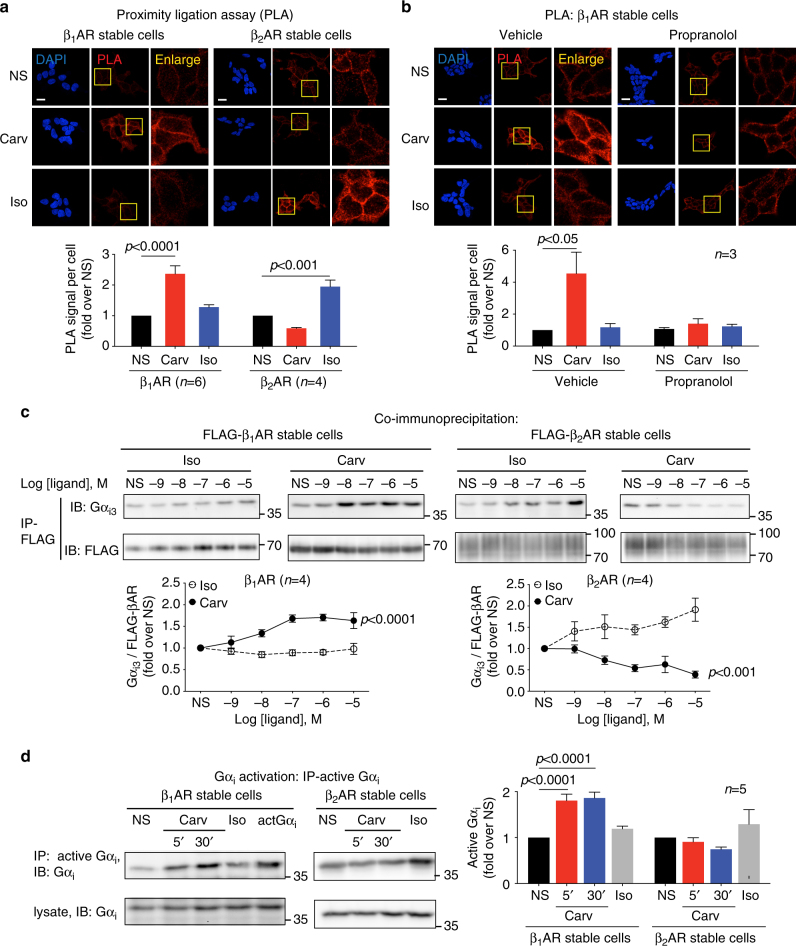
Carvedilol promotes Gαi recruitment and activation in β1AR stable cells, but not in β2AR stable cells. HEK293 cells stably expressing FLAG-tagged β1ARs or β2ARs were stimulated with 10 μM carvedilol or 10 μM isoproterenol for 5 min.
a In proximity ligation assay (PLA), cells were immuno-stained with Gαi antibody raised in mouse and β1AR (or β2AR) antibody raised in rabbit. The red PLA signal represents the protein interactions of Gαi and β1AR (or β2AR). The area in yellow squares are enlarged for better view. Carvedilol promoted Gαi recruitment to β1ARs, but not to β2ARs. Scale bar = 20 μm. b β1AR stable cells were pretreated with vehicle or 10 μM propranolol for 30 min. The βAR antagonist propranolol blocked the carvedilol response, suggesting that β1AR–Gαi coupling is induced by the binding of carvedilol to the β1AR orthosteric binding pocket. Scale bar = 20 μm. c The effect of carvedilol and isoproterenol on Gαi recruitment was confirmed with co-immunoprecipitation assays. FLAG-tagged β1ARs or β2ARs were immunoprecipitated with anti-FLAG M2 beads, and Gαi3 was detected with its specific antibody by western blot. d Carvedilol specifically activated Gαi in β1AR stable cells. Cells were transfected with Gαi2. 48 h after transfection, cells were treated with 10 μM carvedilol for 5 min or 30 min, or 10 μM isoproterenol for 5 min. Activated Gαi was immunoprecipitated with an antibody specifically recognizing the active form of Gαi, and immunoblotted with an Gαi antibody. In the middle lane marked as actGαi, cells were transfected with constitutively active Gαi2, serving as positive control. Carvedilol stimulation activated Gαi in β1AR stable cells, but not in β2AR stable cells. Data represent the mean ± SEM for n independent experiments as marked on the figure. Statistical significance vs. unstimulated cells (NS) was assessed using one-way ANOVA with Bonferroni correction
Immunoprecipitation of Gαi/o Proteins
We used the Gαo (80901) and Gαi (80301) activation assay kits from New East Biosciences. The cultured hippocampal neurons were seeded at a density of 900,000 cells/well at DIV 14 and were treated with Wnt-5a (300 ng/ml). After treatment, cells were lysed, and the amount of protein was quantified. The same amount of protein was used in each condition for the immunoprecipitation (400 μg) with the specific antibodies that recognize the GTP-bound Gαo or the GTP-bound Gαi proteins according to the manufacturer’s recommended protocol. GTPγS was used as a positive control and was added to the neuronal lysate and incubated for 90 min at room temperature before immunoprecipitation. The total level of protein was detected by immunoblot with the mouse anti-Gαo (1:1000) or mouse anti-Gαi (1:1000) antibodies from the activation kits from New East Bioscience.
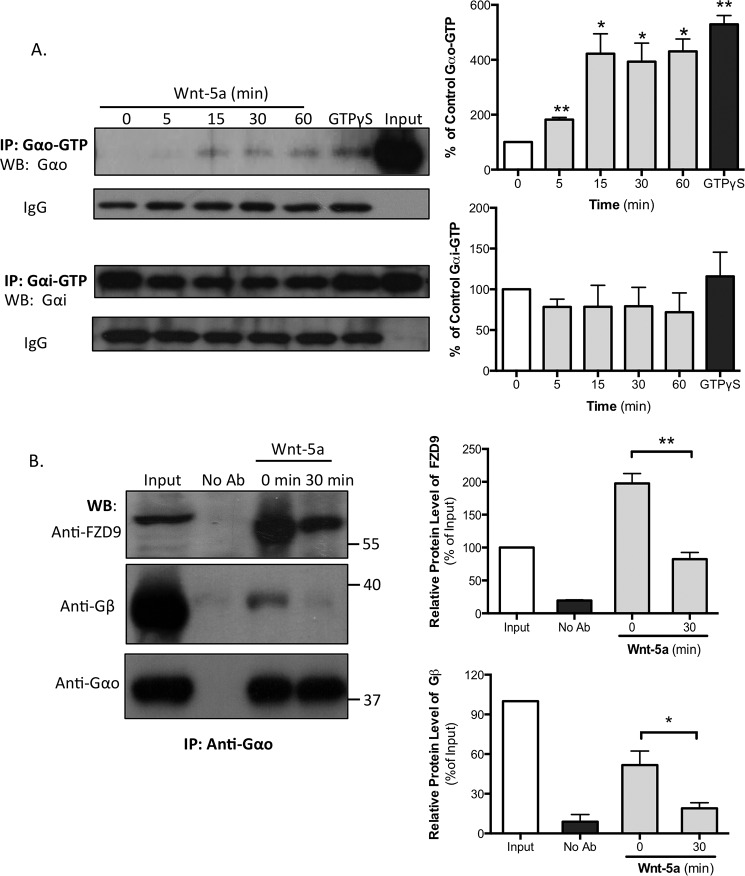
Wnt-5a increases the GDP/GTP exchange of the Gαo subunit, and FZD9 is associated with Gαo in DIV 14 hippocampal neurons.
A, hippocampal neurons were stimulated with recombinant Wnt-5a for the indicated lengths of time. The lysates were incubated with specific antibodies that recognize Gαo-GTP or Gαi-GTP. As a positive control, untreated hippocampal neuron lysates were incubated with GTPγS for 90 min at room temperature and then incubated with the antibody. The lysates were analyzed by SDS-PAGE and immunoblotting with antibodies that recognize the total levels of Gαo or Gαi (n = 3). The IgG band shows that equal amounts of the Gαo/i-GTP antibodies were used for immunoprecipitation. Left panel, representative blot images. Right panel, blot quantifications. B, DIV 13 or 14 neurons were treated or not with Wnt-5a (30 min), and the lysates were immunoprecipitated with an anti-Gαo antibody and immunoblotted with anti-FZD9 and anti-Gβ1–5 (this antibody labels all five Gβ isoforms) (n = 4) in the same membrane. Left panel, representative blot images. Right panel, blot quantifications. **, p < 0.01; *, p < 0.05. No Ab, no antibody was added; WB, Western blotting; IP, immunoprecipitation.
Gαi activation assays
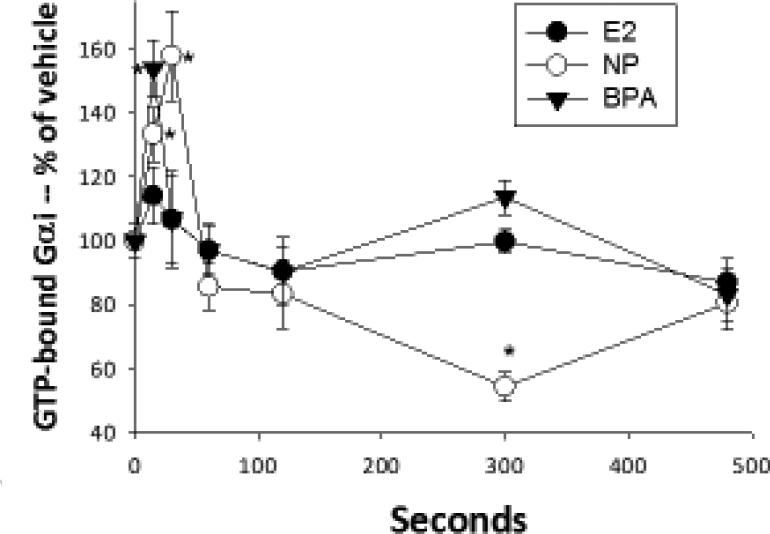
These activations were determined by specific Ab recognition of GTP-bound G proteins in a quantitative plate immunoassay, adapted from our previously developed protocols [39] and see above. This assay was optimized for cell permeabilization conditions, saturating amounts of Ab producing a signal above that of using secondary Ab alone, and for production of a differential signal for total vs. activated G αi, according to NewEast Biosciences company recommendations. Cells were plated at 10,000-13,000 cells/well as for ERK assays above and serum steroid-deprived (incubated in DMEM without serum) for at least 2 hrs before treatment. Cells were then treated with physiological Es or XEs for 10 sec to 8 min. The cells were then processed as described above for the pERK plate assays, except that cells were fixed with 4% PFA for 10 min. The fixed cells were incubated with the primary Ab (anti-GTP-G αi) overnight at 4°C. We assayed 7-8 replicate wells over 3 separate experiments.
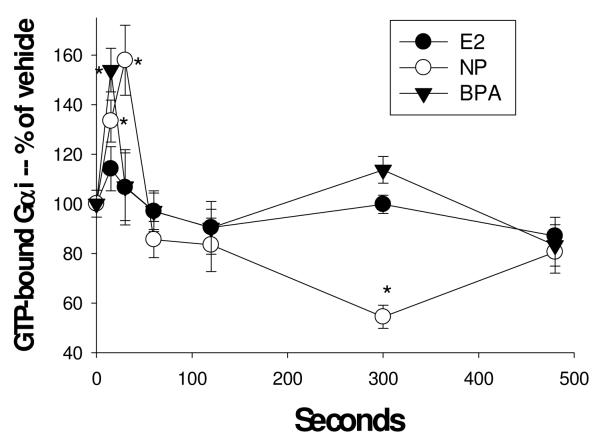
Cells were treated with 1nM estradiol (E2), nonylphenol (NP), and bisphenol A (BPA). GTP-bound Gαi was measured with an Ab specific for the modified protein at various times shown in sec using a plate immunoassay. n=24 samples (over 3 experiments) for each condition, normalized to cell number; *= statistical significance (P<0.05) for each E/XE treatment vs. the vehicle control (shown at time 0).
cAMP and activity assays
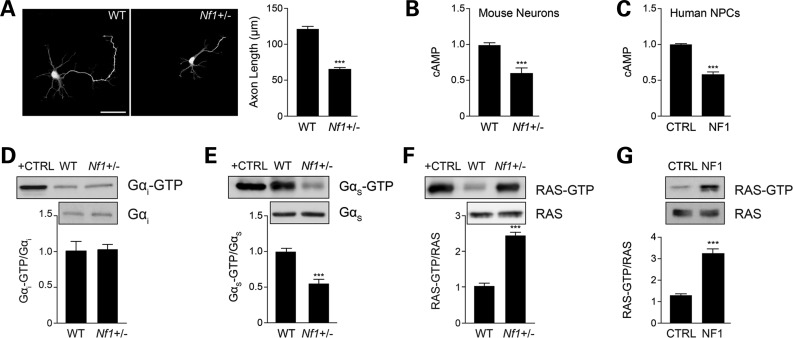
All assays were performed on dissected embryonic hippocampi, snap-frozen in liquid nitrogen. cAMP levels were quantitated from tissue homogenized in 0.1 M HCl, using a cAMP ELISA immunoassay kit (Enzo Life Sciences) following manufacturer’s instructions. GαS and Gαi activity were determined using commercially available activation kits (NewEast Biosciences) following the manufacturer’s instructions. Active Ras (Ras-GTP) was detected by Raf1-RBD immunoprecipitation using the RAS activation kit (Millipore) following manufacturer’s instructions.
(A) Quantification of hippocampal neuron axons lengths by Smi-312 immunostaining. Nf1+/− mouse hippocampal neuron axons are significantly shorter than WT neurons (P < 0.001; n = 200). (B and C) Measurement of cAMP generation in mouse hippocampal neurons and human NF1 patient-derived NPCs (hNF1-NPCs). (B) Nf1+/− neurons have lower cAMP levels relative to their WT counterparts (P = 0.0002; n = 5). (C) hNF1-NPCs have reduced cAMP levels compared with age- and sex-matched controls (P < 0.0001; n = 3). (D and E) Quantification of Gαi and Gαs activation of mouse embryonic hippocampal preparations. (D) Nf1+/− mouse hippocampal preparations show no difference in Gαi activation relative to WT neurons (P = 0.7638; n = 5). (E) Nf1+/− mouse embryonic hippocampal preparations exhibit significantly lower Gαs activity (Gαs-GTP) than their WT counterparts (P = 0.0001; n = 8). (F and G) Measurement of RAS activation in mouse neurons and human NPCs. (F) Nf1+/− mouse hippocampal neurons exhibit higher levels of RAS activation (P = 0.0027; n = 5). (G) hNF1-NPCs (NF1) exhibit higher levels of RAS activation than control (CTRL) NPCs (P = 0.0002; n = 3). Data are presented as means ± SEM (n ≥ 3). ***P < 0.001; Student’s t-test.
Active Gαi Protein Immunoprecipitation
N18TG2 cells or freshly isolated hippocampal tissues were lysed in 1% Triton, 20 mm Tris HCl, pH 7.5, 150 mm NaCl, 1 mm EDTA, 1 mm EGTA, and proteinase inhibitors. Anti-active Gαi mouse monoclonal antibody (1 μg) was mixed with 500 μl of lysates containing 100 μg of protein for 60 min at 4 °C. Protein A/G beads were added and mixed further for 30 min. Beads were washed with lysis buffer, and precipitated proteins were resolved by SDS-PAGE and Gαi visualized by immunoblots.
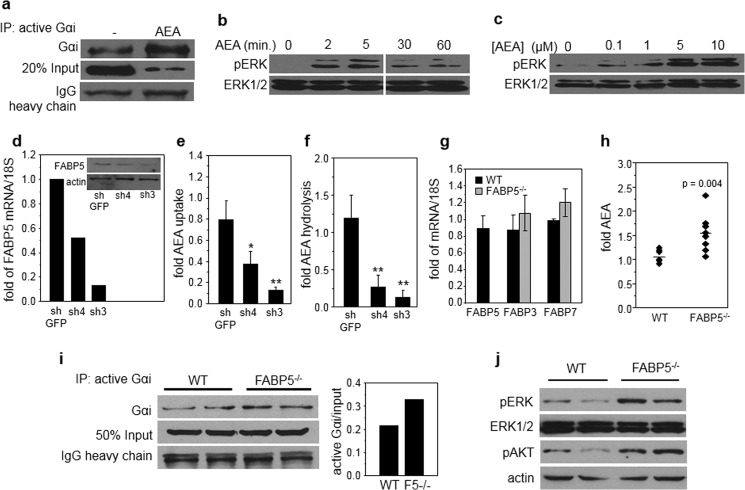
a, N18TG2 cells were treated with AEA (10 μm, 60 min), and active Gαi was immunoprecipitated (IP) and visualized by immunoblots. Immunoblots of 20% of total lysate (20% Input) and the heavy chain of the antibody (IgG heavy chain) are shown as controls for total expression of Gαi and precipitation efficiency, respectively. b, N18TG2 cells were treated with AEA (5 μm), and the phosphorylation level of ERK (pERK) at denoted times was monitored by immunoblots. c, N18TG2 cells were treated with denoted concentrations of AEA for 5 min, and the phosphorylation level of ERK was monitored by immunoblots. d, levels of FABP5 mRNA in N18TG2 cell lines expressing different levels of FABP5, measured by Q-PCR. Inset, immunoblots of FABP5 in N18TG2 cell lines expressing different levels of FABP5. e and f, rates of uptake (e) and hydrolysis (f) of AEA in N18TG2 lines stably expressing varying levels of FABP5. See “Experimental Procedures” for details. Data are mean ± S.D. (n = 3). *, p < 0.05, **, p < 0.01. g, levels of mRNA for FABP3, FABP5, and FABP7 in whole brains of WT and FABP5−/− mice, measured by Q-PCR. Data are mean ± S.D. n = 3. h, levels of AEA in whole brains of 12–14-week-old FABP5−/− male mice and WT littermates. n = 10/group. See “Experimental Procedures” for details. i, left, levels of active Gαi protein in hippocampus of two WT and two FABP5−/− mice, assessed by immunoblots following immunoprecipitation of active Gαi. Right, quantification of immunoblots. j, immunoblots of phospho-ERK (pERK) and phospho-AKT (pAKT) in hippocampus of two WT and two FABP5−/− mice.
Active Gαi Protein Immunoprecipitation
N18TG2 cells or freshly isolated hippocampal tissues were lysed in 1% Triton, 20 mm Tris HCl, pH 7.5, 150 mm NaCl, 1 mm EDTA, 1 mm EGTA, and proteinase inhibitors. Anti-active Gαi mouse monoclonal antibody (1 μg) was mixed with 500 μl of lysates containing 100 μg of protein for 60 min at 4 °C. Protein A/G beads were added and mixed further for 30 min. Beads were washed with lysis buffer, and precipitated proteins were resolved by SDS-PAGE and Gαi visualized by immunoblots.
Western blot analyses
Whole-cell lysates
SDS-PAGE of cell lysates (40 µg/lane) was carried out as described (21).
Gαi activation assays
Cell surface protein purification
Figure 2 SHH pathway activation is required for CXCR4 signaling in medulloblastoma.
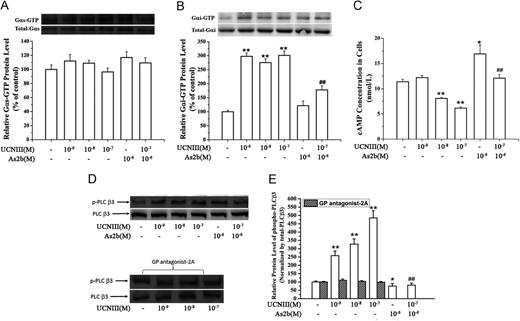
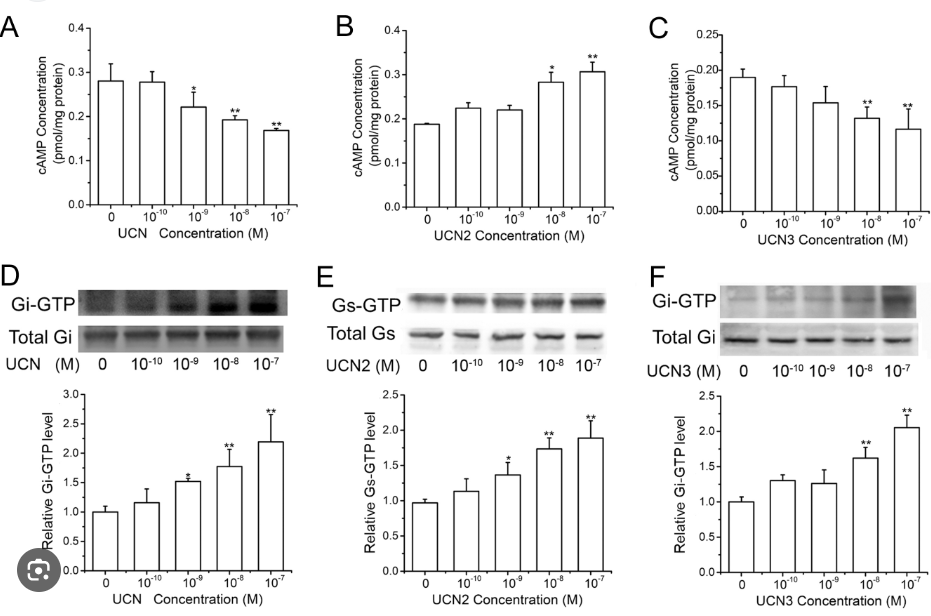
Measurement of activated Gαs and Gαi protein levels
The levels of activated, GTP-bound Gαs and Gαi proteins were measured using commercially available Gαs and Gαi activation assay kits. Trophoblast cells or CRH-R2 knockdown trophoblast cells were treated with increasing concentrations of CRH and UCNIII for 5 min in the absence and presence of antalarmin or astressin-2b, and cells were then scraped off the plate in the presence of lysis buffer. The cell lysate was centrifuged for 10 sec at 12,000 × g, and the supernatant was used to immunoprecipitate with antiactive Gαs or antiactive Gαi monoclonal antibody and the protein A/G beads. After incubating at 4 C for 1 h, the beads were washed three times (10 min each) in lysis buffer. Bound proteins were analyzed by Western blot with anti-Gαs or anti-Gαi monoclonal antibody. To control sampling errors and normalize results, the total Gαs or Gαi protein was also detected.
CRH-R2 activates Gi and Gq signaling pathways. Placental cells were treated with specific CRH-R2 agonist UCNIII at the indicated concentrations in the absence or presence of astressin-2b (10−6M) for 5 min. Levels of GTP-bound Gαs protein, GTP-bound GαI protein, cAMP content, and pPLC-β3 protein were determined as described in Materials and Methods. A and B, Effect of UCNIII on the expression of GTP-bound Gαs protein and GTP-bound GαI protein. Representative protein bands of GTP-bound Gαs/Gαi protein and total Gαs/Gαi protein were presented on the top of corresponding histogram. C, Effect of UCNIII on cAMP production in placental cells. D and E, Effects of UCNIII on the pPLC-β3 and the effect of GP antagonist-2A on UCNIII-induced pPLC-β3. Cells were treated with increasing concentration of UCNIII in the absence or presence of astressin-2b for 5 min, or cells were transfected with a small inhibitory peptide of Gq protein GP antagonist-2A for 2 h and then treated with CRH at the indicated doses for 5 min. The levels of pPLC-β3 were analyzed by Western blotting. D, Representative protein bands of pPLC-β3 and total PLC-β3 in response to UCNIII treatment. E, Summary histogram of UCNIII effect on pPLC-β3. Values are presented as mean ± SEM (C) or the mean percent control ± SEM (A, B, D, and E) for a total of four placenta cultures obtained from four patients. *, P < 0.05, **, P < 0.01 vs. vehicle control; ##, P < 0.01 compared with UCNIII (10−7M). As2b, Astressin-2b.
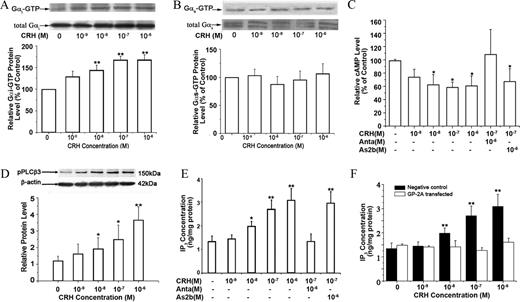
Measurement of activated Gs and Gi protein levels
The levels of activated, GTP-bound Gs and Gi proteins were measured using commercial Gs and Gi activation assay kits (NewEast Biosciences, Malvern, PA). Myometrial cells were treated with increasing concentrations of CRH for 5 min and then scraped off the plate in the presence of lysis buffer. The cell lysate was centrifuged for 10 sec at 12,000 × g, and the supernatant was immunoprecipitated with anti-active Gs or Gi monoclonal antibody and the protein A/G beads. After incubating at 4 C for 1 h, the beads were washed three times (10 min each) in lysis buffer. Bound proteins were analyzed by Western blot with anti-Gs or anti-Gi monoclonal antibody. To control sampling errors, the total Gs or Gi protein was also detected.
CRH stimulates Gi and Gq signaling pathways in TL myometrium cells. Cells were treated with CRH at the indicated concentration in absence or presence of antalarmin (Anta) or astressin 2B (As2b). Levels of GTP-bound Gi protein, GTP-bound Gs protein, and phosphorylated PLC-β3 (pPLCβ3) protein were analyzed as described in Materials and Methods. Concentrations of intracellular cAMP and IP3 were analyzed by RIA and ELISA, respectively.
A and B, Effects of CRH on GTP-bound Gi protein (A) and GTP-bound Gs protein (B). Representative protein bands of GTP-bound Gi protein and Gs protein are on the top of histograms (n = 3 cultures). C, Effect of CRH on cAMP production in TL cells (n = 4 cultures). D, Effect of CRH on phosphorylated PLCβ3 (pPLCβ3). Representative protein bands of pPLCβ3 are on the top of histograms (n = 3 cultures). E, Effect of CRH on intracellular IP3 concentration (n = 3 cultures). F, Effect of inhibitory peptide of Gq protein GP antagonist-2A on CRH-induced IP3 production. Cells were transfected with a small inhibitory peptide of Gq protein GP antagonist-2A or negative control peptide for 2 h and treated with CRH at the indicated doses for 10 min, and then levels of intracellular IP3 were analyzed by ELISA (n = 3 cultures). Data are expressed as mean ± SEM. *, P < 0.05; **, P < 0.01 vs. vehicle control.
Gαi and Gαs activation assays
The activation of Gαi and Gαs was determined by Ab recognition of the levels of these proteins that were GTP-bound in a quantitative plate immunoassay, adapted from our previously developed protocols [39]. This assay was optimized for cell permeabilization conditions, saturating amounts of Ab producing a signal above that of using secondary Ab alone, and for production of a differential signal for total vs. activated Gαi, according to NewEast Biosciences company recommendations. Cells were plated at 10,000-13,000 cells/well in 96-well plates, and serum steroid-deprived (were incubated in DMEM without serum) for at least 2 hrs before treatment. Cells were then treated with physiologic estrogens or xenoestrogens for 15 sec to 8 min. The cells were then processed as described above for the pERK plate assays, except that cells were fixed with 4% PFA for 10 min, and 100μM GTPγS was additionally added, when required, with the permeabilization solution. The fixed cells were incubated with the primary Abs (anti-GTP-Gαi or anti-GTP-Gαs) overnight at 4°C. Replicates of 7-8 wells were performed for GTP-G proteins over 2-3 separate experiments. When we originally developed these types of plate immunoassays for quantitating various receptor and activated signaling proteins, we used nonspecific IgGs instead of specific primary Abs as negative controls, to determine the specificity of this technique for identifying the protein of interest [39], and thus have not repeated those studies again here. We have now utilized this assay format to quantify a variety of proteins in GH3/B6/F10 cell membranes or cell interiors including: ERs and β, GPR30, clathrin, three activated MAPK subtypes, and the activated transcription factors Elk-1 and ATF-2 .
Cells were treated with 1nM estradiol (E2), nonylphenol (NP), and bisphenol A (BPA). GTP-bound Gαi was measured with an Ab specific for the complex at various times shown in sec. n=24 samples (over 3 experiments) for each condition; *= statistical significance (P<0.05) for each estrogen/xenoestrogen treatment vs. the vehicle control (shown at time 0).
Gαi and Gαs activation assays
The activation of Gαi and Gαs was determined by Ab recognition of the levels of these proteins that were GTP-bound in a quantitative plate immunoassay, adapted from our previously developed protocols [39]. This assay was optimized for cell permeabilization conditions, saturating amounts of Ab producing a signal above that of using secondary Ab alone, and for production of a differential signal for total vs. activated Gαi, according to NewEast Biosciences company recommendations. Cells were plated at 10,000-13,000 cells/well in 96-well plates, and serum steroid-deprived (were incubated in DMEM without serum) for at least 2 hrs before treatment. Cells were then treated with physiologic estrogens or xenoestrogens for 15 sec to 8 min. The cells were then processed as described above for the pERK plate assays, except that cells were fixed with 4% PFA for 10 min, and 100μM GTPγS was additionally added, when required, with the permeabilization solution. The fixed cells were incubated with the primary Abs (anti-GTP-Gαi or anti-GTP-Gαs) overnight at 4°C. Replicates of 7-8 wells were performed for GTP-G proteins over 2-3 separate experiments. When we originally developed these types of plate immunoassays for quantitating various receptor and activated signaling proteins, we used nonspecific IgGs instead of specific primary Abs as negative controls, to determine the specificity of this technique for identifying the protein of interest [39], and thus have not repeated those studies again here. We have now utilized this assay format to quantify a variety of proteins in GH3/B6/F10 cell membranes or cell interiors including: ERs and β, GPR30, clathrin, three activated MAPK subtypes, and the activated transcription factors Elk-1 and ATF-2 .
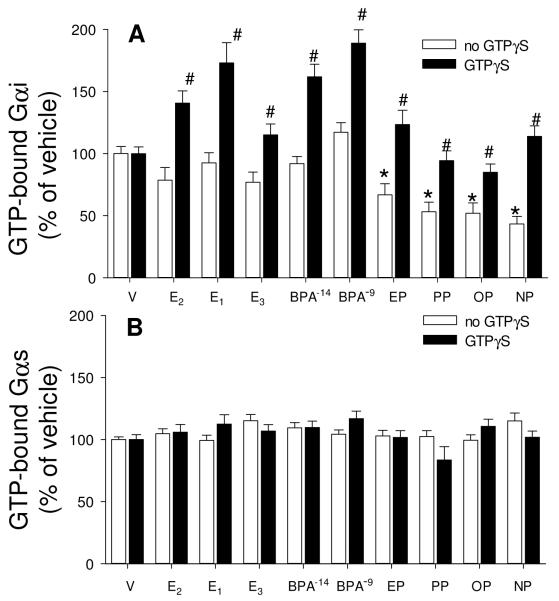
Cells were treated with vehicle (V), estradiol (E2), estrone (E1), estriol (E3), bisphenol A (BPA), ethylphenol (EP), propylphenol (PP), octylphenol (OP) and nonylphenol (NP) for 5 min, all estrogens at 1nM, except that BPA was additionally tested at 10 fM. GTP-bound Gαi (A) and Gαs (B) were measured by recognition with an Ab selective for these GTP-bound forms in the absence (white bar) or presence (dark bar) of 100μM GTPγS. Total Gαi and Gαs were also measured, but did not differ under any conditions of estrogen treatments (data not shown). For statistical annotations: For A *= statistical significance (P<0.05) from paired V control for the no GTPγS group. #= GTPγS-treated group statistical significance (P<0.05) from paired estrogen-treated levels; n=48 without, and n=32 with GTPγS treatment over 3 experiments. For B n=32 without and n=16 with GTPγS treatment over 2 experiments.
Active Gαi Pulldown Assay.
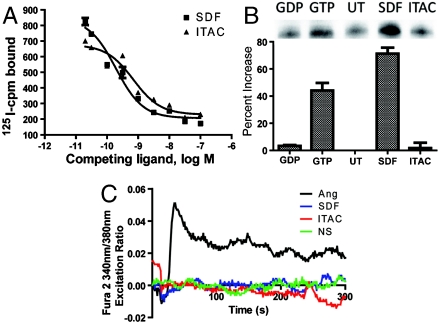
rVSMCs were starved for 48 h prior to 5 min of stimulation with SDF-1α or ITAC (positive control). After 5 min, the cells were placed on ice, washed with ice cold PBS and lysed, solubilized for 1 h, and then incubated for 1 h with an antiactive Gαi antibody and Protein A-agarose beads (New East Biosciences). Beads were washed with lysis buffer three times and incubated with SDS-PAGE buffer at 95 °C for 10 min and run on a 4–20% gradient polyacrylamide gel, transferred to nitrocellulose membrane, and incubated with anti-Gαi antibody.
(A) Treatment with unlabeled ITAC or SDF competes off radiolabeled SDF-1α from rVSMCs. (B) Activation of Gαi in SDF-1α-treated rVSMCs (SDF) but not in untreated (UT) or ITAC-treated (ITAC) samples. The negative control was incubated with GDP (GDP) and the positive control incubated with GTP (GTP) for 90 min prior to immunoprecipitation. Data shown are mean ± SEM from three independent experiments. (C) Absence of calcium influx as assessed by change in Fura-2 fluorescence emission ratio upon stimulation of rVSMCs with SDF-1α (blue) or ITAC (red) compared to Angiotensin II (black) from a representative experiment from three independent experiments.
Gαi and Gαs activation assays
The levels of activated GTPbound Gαs and Gαi proteins were measured using their corresponding assay kits [2, 27]. Whole-cell lysates were incubated for 1 h with an anti-active Gαi antibody and protein A agarose beads. Activated Gαi was quantified by means of western blotting using an anti-Gαi antibody. As a control for sampling errors, total levels of the Gαs and Gαi proteins were also detected.