


Published Pictures for 26902 Gα13-GTP mAb
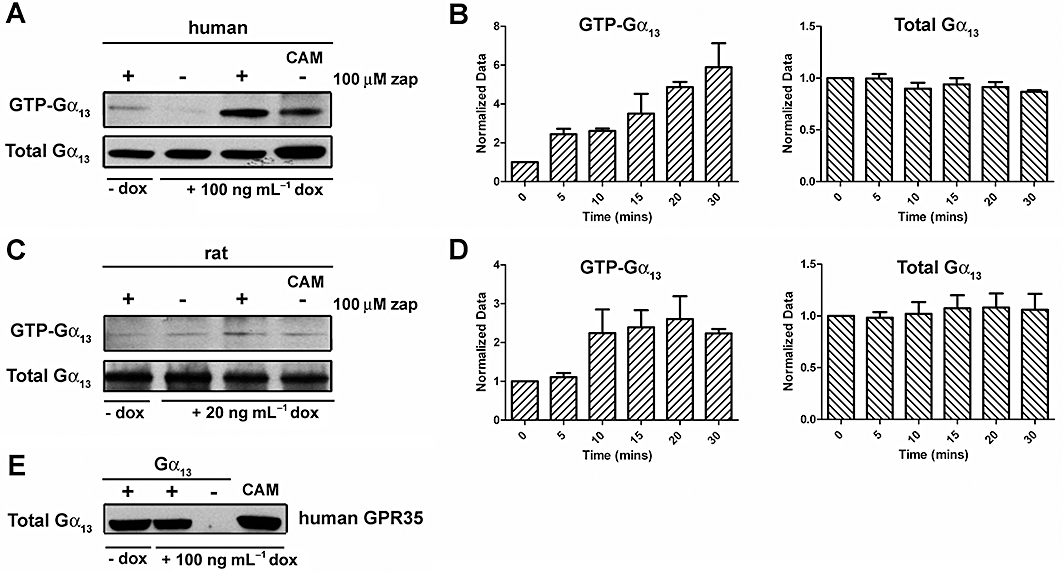
Gα13 activation assay
Gα13 activation assays were performed using a Gα13 activation assay kit (NewEast Biosciences) according to the manufacturer’s instructions. Flp-In™ T-REx™ 293 cells able to express FLAG-tagged human GPR35-eYFP or FLAG-tagged rat GPR35-eYFP in response to doxycycline were induced and incubated for varying times with either vehicle or agonist. Cells were immediately washed with ice-cold phosphate-buffered saline and prepared in ice-cold lysis buffer. Lysates were incubated with the anti-active-state Gα13 mouse monoclonal antibody. Gα13-GTP was then recovered using protein A/G agarose and the precipitated Gα13-GTP was detected following SDS-PAGE by immunoblot analysis using a conformation insensitive anti-Gα13 rabbit polyclonal antiserum. Parallel immunoblots of cell lysates with the polyclonal anti-Gα13 antiserum assessed total cell levels of this G protein.
Endogenous Gα13 activation assay
Immunoblot analysis
Immunoblot analyses were performed according to previously published methods ( 22 ). Briefly, the cells were lysed in buffer containing 10 mM Tris–HCl (pH 7.1), 100 mM NaCl, 1 mM ethylenediaminetetraacetic acid, 10% glycerol, 0.5% Triton X-100, 0.5% Nonidet P-40, 1 mM dithiothreitol and 0.5 mM phenylmethylsulfonyl fluoride, supplemented with a protease inhibitor cocktail (Calbiochem). Proteins of interest were visualized by the ECL chemiluminescence detection kit (Amersham Biosciences, Buckinghamshire, UK).
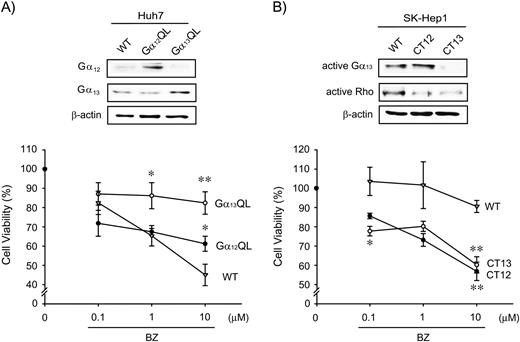
Changes in the cytotoxic effect of bortezomib (BZ) by Gα 12 or Gα 13 activity modulations.
( A ) The cytotoxicity of bortezomib (10 μM, 24 h treatment) was assessed in Huh7 cells that had been stably transfected with a constitutively active mutant of Gα 12 or Gα 13 (Gα 12 QL or Gα 13 QL). Data represent the mean ± SE of three independent experiments (* P < 0.05, ** P < 0.01, significant compared with wild-type (WT) cells treated with bortezomib at respective concentrations). Immunoblottings for Gα 12 or Gα 13 verified transfection efficiency. ( B ) The cytotoxicity of bortezomib was measured in SK-Hep1 cells that had been transfected with Gα 12 or Gα 13 minigene (CT12 or CT13). Data represent the mean ± SE of three independent experiments (* P < 0.05, ** P < 0.01, significant compared with wild-type cells treated with bortezomib at respective concentrations). Immunoblottings for active Gα 13 or active Rho confirmed transfection efficiency of the minigenes. Equal loading of proteins was confirmed by immunoblottings for β-actin. Results were confirmed by three independent experiments.
