


Published IH and IHC Pictures for 26903 Rac1-GTP mAb - Part 01
Histological and immunohistochemical procedures
Antibodies used were against active Rac1-GTP (Neweast Biosciences cat. no.: 26903), Rac1 (Santa Cruz Biotechnology Inc. cat. no.: sc-217). In both cases, antigen retrieval was carried out by heating sections of FFPE tissue at 99uC for 20 minutes in 10mM citrate buffer, pH 6.0 followed by blocking in 3% hydrogen peroxide in phosphate buffered saline (pH 7.0) for 20 minutes and 5% goat serum/PBS for 20 minutes. Incubation with the appropriate primary antibody was carried out at 4uC overnight in a humidified atmosphere. Following thorough washing in tap water, Envision Dual-link-HRP reagent (Dako) was applied and incubated at room temperature for 1 hour in a humidified atmosphere. After several rounds of washing in tap water, color development was carried out using DAB chromogen (Dako). Slides were counterstained in haematoxylin, dehydrated, cleared and mounted in DPX (Sigma). Slides were imaged using a Hamamatsu Nanozoomer NDP slide scanner (Hamamatsu Photonics) and Digital Slide Server (Slidepath) software.
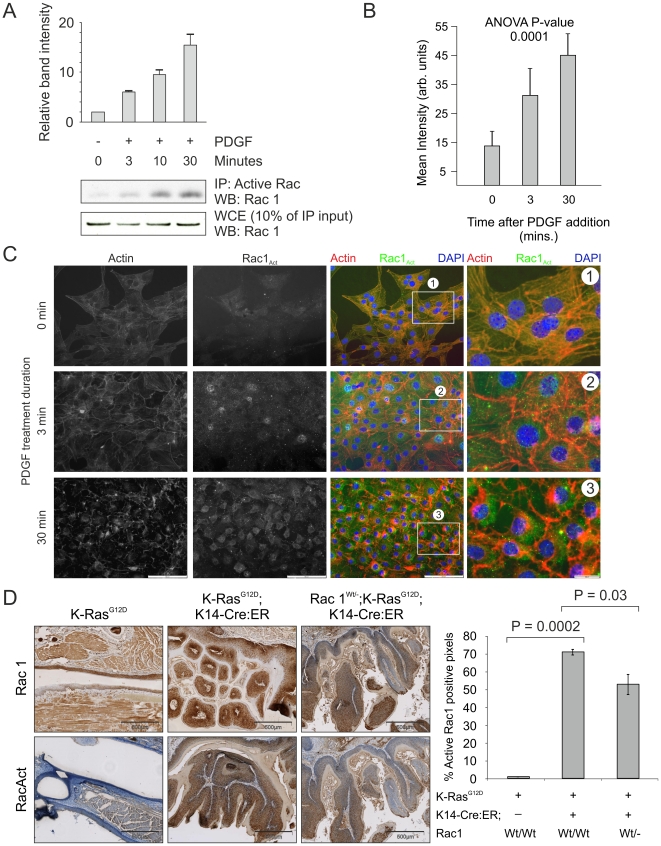
K-Ras activation of Rac in vivo.
(A) Active Rac1 was immunoprecipitated from lysates derived from NIH 3T3 cells that had been treated for the indicated time periods with PDGF (10 ng/ml). Western analysis for Rac1 was carried out on immunoprecipitated protein as well as the original lysate as indicated. (B) Histogram showing active Rac1 immunofluorescence intensity averaged over 5 fields of NIH 3T3 cells increasing over the indicated time periods of PDGF treatment. (C) Staining for actin with Texas-red conjugated phalloidin (red) and co-immunofluorescence for active Rac1 (green) in representative fields of NIH 3T3 cells used in the quantification shown in panel B, demonstrating increased active Rac1 and changes to the actin cytoskeleton over the indicated time periods of PDGF treatment. Boxed areas indicated by numbers 1-3 are shown enlarged. (D) Immunohistochemical analysis for Rac1 and active Rac1 of oral mucosa from LSL-K-RasG12D, LSL-K-RasG12D; K14-Cre:ER and Rac1Wt/-; LSL-K-RasG12D; K14-Cre:ER showing dramatic increase in active Rac1 in LSL-K-RasG12D; K14-Cre:ER tissue, which is reduced when one Rac1 allele is lacking. Histogram shows results of positive pixel analysis for active Rac1staining.
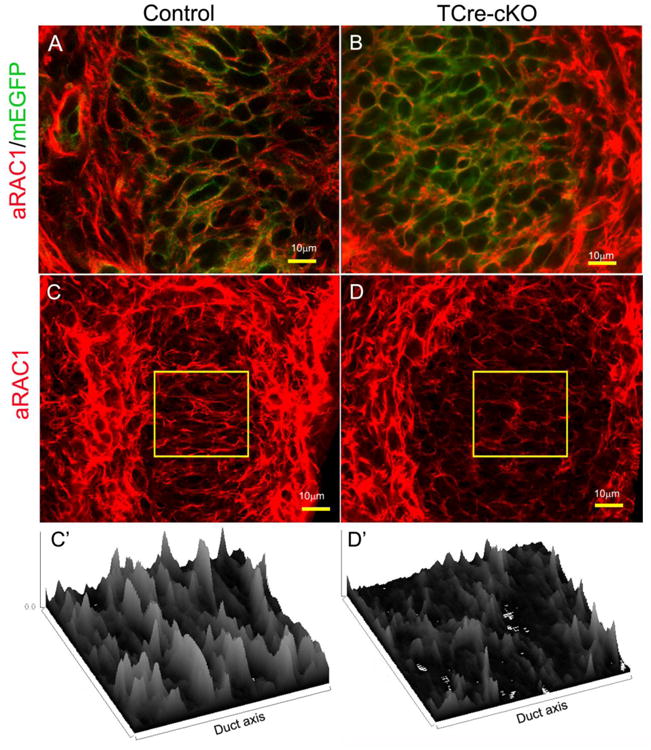
Immunolocalization of active RAC1 (aRAC1) in the Wolffian duct SMM of E18.5 controls and TCre-cKOs. (A-B) Co-localization of active RAC1 (red) with membrane EGFP (green) in SMM cells of controls and TCre-cKOs. Cell membranes of all epididymal cells are green because the mouse line carries a floxed mTmG cassette. (C-D) 3D reconstruction images of active RAC1 in SMM cells of controls and TCre-cKOs. (C′-D′) Corresponding surface plots of the selected areas in C and D showing bundles of RAC1-GTP positive fiber orients perpendicularly towards the duct elongation axis in control SMM cells but not in TCre-cKOs.
4.4 Immunofluorescence
Wolffian duct tissue samples were immersion-fixed in 4% paraformaldehyde (PFA) in PBS (phosphate buffered saline) overnight at 4°C followed by paraffin embedding and sectioning. Knockout and control sections were placed on the same slide side by side to ensure similar treatment. Subsequently, slides were deparaffinized and rehydrated. For antigen retrieval, slides were microwaved in antigen unmasking solution (Vector Laboratories, Burlingame, CA) for 10 minutes on high in a 1300 W microwave and cooled for 1hour at room temperature. Following blocking in blocking solution with 10% (v/v) normal goat or donkey serum (Vector Laboratories, Burlingame, CA), 0.5% (v/v) gelatin from cold-water fish skin (Sigma, St. Louis, MO), and TBS (tris-buffered saline) for 1.5 hours, slides were incubated overnight at 4°C in blocking solution with the primary antibodies. Following washing in TBS, slides were incubated with 1:250 dilution of Alexa Fluor 594 secondary antibodies (Molecular Probe, Eugene, OR) in blocking solution for 1.5 hours at room temperature. All slides were washed in TBS and mounted using Prolong Anti-fade reagent with DAPI for nuclear staining (Molecular Probe, Eugene, OR) and viewed under a Zeiss microscope equipped with epifluorescence. COL4 (collagen, type IV) antibody (#AB769, 1:200 working dilution) was purchased from Millipore (Billerica, MA).
4.5 Whole mount immunofluorescence and confocal and two-photon-imaging
E18.5 to P1 Wolffian ducts were fixed in 4% PFA at 4°C for 1-3 hours prior to washes in PBS at room temperature and permeabilized in tsPBS (0.5% Triton X-100 and 0.1% saponin in PBS) at 4°C overnight on a rocker. Samples were then incubated in a blocking solution (10% normal goat serum in tsPBS) for 1 hour at room temperature and then incubated overnight at 4°C in blocking solution with the primary antibodies. Following washing in tsPBS, slides were incubated with 1:200 dilution of Alexa Fluor 594 secondary antibodies (Molecular Probe, Eugene, OR) in blocking solution overnight at 4°C. All samples were post-fixed in 4% PFA at 4°C for 0.5 hour and then washed and stored in PBS before imaging. Samples were then incubated in Sca/eA2 solution (4M urea, 10% glycerol, and 0.1% Triton X-100) (Hama et al., 2011) for at least 0.5 hour before visualizing under a Zeiss 780 confocal microscope. Primary antibodies included phospho-RLC antibody (#31694, 1:100 working dilution) from Rockland (Limerick, PA); Laminin antibody (#L9393, 1:200 working dilution) from Sigma-Aldrich (St. Louis, MO); COL4 (collagen, type IV) antibody (#AB769, 1:200 working dilution) from Millipore (Billerica, MA); Active RAC1-GTP antibody (#26903, 1:400 working dilution) from NewEast Biosciences (King of Prussia, PA); NPNT antibody is gifted from Dr. Hironobu Fujiwara (RIKEN Center for Developmental Biology, Kobe, Japan) (Linton et al., 2007).
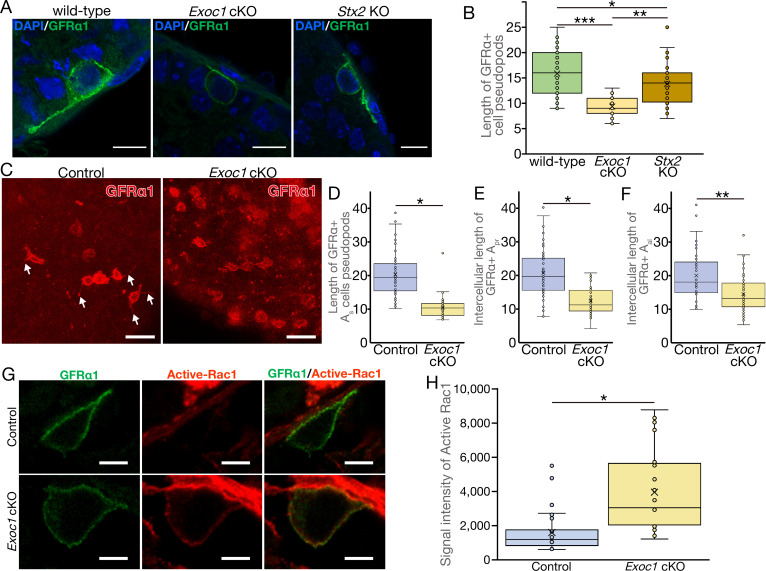
EXOC1 regulates pseudopod elongation via Rac1 inactivation.
(A)….. (G) A representative image of active-Rac1 in GFRα1+ spermatogonia of Exoc1 cKO adult testis. In control mice (Exoc1flox/wt:: Nanos3+/Cre), active-Rac1 signal was lower than the detection limit. Non-polar active-Rac1 signal was detected in Exoc1 cKO adult testis. Scale bars: 5 μm. (H) Quantification of signal intensity of active-Rac1 in GFRα1+ spermatogonia based on immunostaining images. The average intensity in each cell is higher in the Exoc1 cKO group than that in the control group (n = 3 in genotype, 8–10 cells in each mouse). *p=0.000036, Student’s t-test. Control: Exoc1flox/flox.
Immunofluorescence and lectin staining
All immunofluorescence experiments except for active-Rac1, SYCP3, and SYCP1 were performed with paraffin sections. The paraffin sections were prepared similar to that of the H and E staining. After deparaffinization and rehydration, sections were permeabilized with 0.25% TritonX-100 in PBS and autoclaved (121°C, 10 min) with Target Retrieval Solution (Agilent Technologies, Santa Clara, California). Sections were incubated with Blocking One Histo (Nacalai Tesque Inc, Kyoto, Japan) for 15 min at 37°C. Primary antibodies (Key Resources Table) that were diluted with Can Get Signal Immunoreaction Enhancer Solution A (Toyobo Co. Ltd., Osaka, Japan) were applied and slides were incubated for 1 hr at 37°C. Alexa Fluor-conjugated secondary antibodies (Key Resources Table) were diluted with Can Get Signal Immunoreaction Enhancer Solution A, and applied for 1 hr at 37°C. Prolong gold antifade reagent with DAPI (Thermo Fisher Scientific, Waltham, Massachusetts) was used as a mounting media and for DAPI staining. Active-Rac1 immunofluorescence was performed with frozen sections. To prepare frozen sections, the tunica albuginea was removed from the testes, and the testes were fixed with 4% paraformaldehyde overnight at 4°C. Fixed testes were then soaked in 30% sucrose in PBS overnight at 4°C and embedded in Tissue-Tek O.C.T. Compound (Sakura Finetek, Tokyo, Japan). Tissues were sliced at 14 μm using HM525 NX Cryostat (Thermo Fisher Scientific, Waltham, Massachusetts). Permeabilization, blocking, and antibody reactions were performed similar to that used in immunofluorescence with paraffin sections. Whole-mount immunofluorescence of seminiferous tubules for GFRα1 (Key Resources Table) was performed as reported previously (Kitadate et al., 2019). Meiotic pachytene chromosome spread and immunofluorescence for SYCP1 and SYCP3 (Key Resources Table) was performed as reported previously (Peters et al., 1997). Samples were observed under a BZ-9000 fluorescence microscope (Keyence, Osaka, Japan), a SP8 Confocal Laser Scanning Microscopy (Leica microsystems, Wetzlar, Germany), and an LSM 800 with Airyscan (ZEISS, Oberkochen, Germany). PNA-lectin (Key Resources Table) staining was performed similar to that of immunofluorescence.
Image analyses
The elongation of the pseudopod and the distance between connected cells in whole-mount immunofluorescence assay, signal intensity of active-Rac1immunofluorescence, and the area of seminiferous tubule sections were calculated using ImageJ Fiji 1.53 c JAVA 1.8.0_172 (64-bit). All image data were selected randomly. For pseudopod extension analysis, the distance between the center (‘Centroid’) of the cell body and the tip of the pseudopod, at the furthest point from the cell body, was measured. For the analysis of the distance between connected cells, the distance between the centers (‘Centroid’) of each cell body was measured. For intensity analysis, we measured the intensity of active-Rac1 in GFRα1+ cells using immunofluorescence images. After selecting GFRα1+ cells, we calculated the signal intensity of active-Rac1, which was converted from RGB to 16-bit. The average intensity of the signal (‘Mean Gray Value’) was calculated so that the size of the cells would not affect the measurement.
Immunofluorescence microscopy of YAP/TAZ localization, polarization of Rac-GTP
After treatment, cells were fixed with 4% PFA, permeabilized with 0.1 % Triton X, blocked with 5% BSA, and incubated with primary antibodies (YAP, 1:100; CST, MA, USA) and secondary antibody Alexa Fluor 488 (Invitrogen, 1:1000 dilution). Samples were mounted using anti-fade media containing DAPI (Vector Laboratories, H-1500) and immunofluorescence was detected using fluorescence microscopy Echo Revolve (Echo, San Diego, CA). Cells in five randomly views (more than100 cells) were selected for the quantification of YAP/TAZ localization as described previously[43].
For Rac and Akt polarization and activation, after 16 h starvation, cells were treated with point-source PDGF at 1 μg/ml, immediately fixed with 4% PFA and permeablization with 0.25% Triton X. Cells were stained overnight with anti-Rac1-GTP (NB-26903, NewEast Biosciences, King of Prussia, PA) and anti-p-AKT 473 (4060, CST). The cells were stained with secondary anti-rabbit IgG Fab-Alexa Fluor 555, or anti-mouse IgM Fab-Alexa Fluor 488 (Thermo Fisher). DNA was stained with DAPI and the coverslips were mounted using Flouromount-G. Signal intensity was calculated dividing the total intensity (IntDens) by the area of the image, for each channel. Images were analyzed using ImageJ (v1.52, NIH, Bethesda MD) as previously[40].
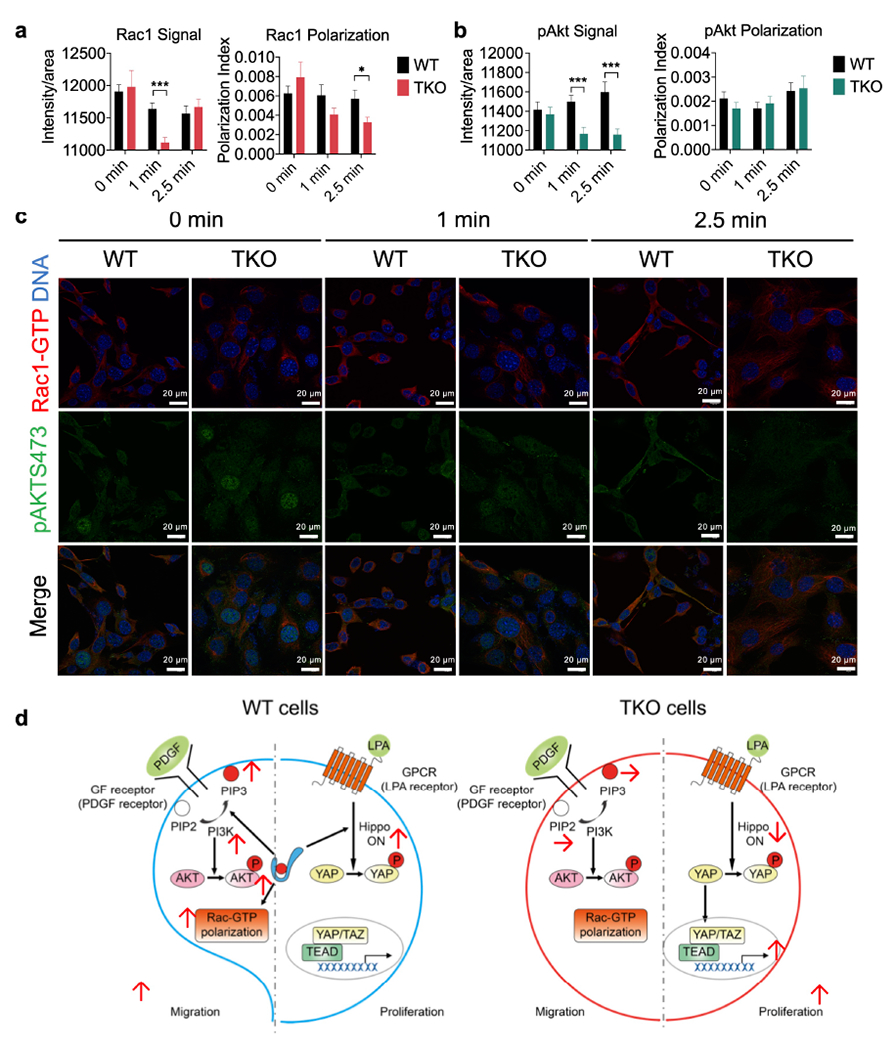
a-c, Rac1-GTP (a, p=0.00002 for Rac Signal, p=0.02277 for Rac polarization) and pAKT473 (b, p=0.000453 and 0.0007 for pAkt Signal at 1 and 2.5 min) polarization and activation in pooled five WT (573, 604, 2595, 3850 and 3853) and four TKO (717, 719, 720 and 7320) fibrosarcoma cells stimulated with PDGF (1 μg/ml) for the indicated amounts of times as determined by confocal microscopy. Results are pooled from 3 independent experiments, with ≥17 cells/condition analyzed per experiment. Total N per condition ≥67. Scale bars = 20 μm. *p < 0.05; ***p < 0.001 vs WT; data are presented as mean ± SEM. Statistical significance was determined by two-tailed unpaired t-test.
d, A working model for the paradoxical function of TNFAIP8 in tumor cell proliferation and migration. In migrating cells, TNFAIP8 sensitizes cells to PDGF stimulation to generate more PIP3 (through lipid transfer) and more Rac1-GTP polarization, promoting cell migration. By contrast, in proliferating cells, TNFAIP8 controls hippo activation and decreases YAP nucleus translocation, reducing the rate of cell proliferation.
Visualization of Rac1-GTP and pAKT473 signaling, and a working model.
a-c, Rac1-GTP (a, p=0.00002 for Rac Signal, p=0.02277 for Rac polarization) and pAKT473 (b, p=0.000453 and 0.0007 for pAkt Signal at 1 and 2.5 min) polarization and activation in pooled five WT (573, 604, 2595, 3850 and 3853) and four TKO (717, 719, 720 and 7320) fibrosarcoma cells stimulated with PDGF (1 μg/ml) for the indicated amounts of times as determined by confocal microscopy. Results are pooled from 3 independent experiments, with ≥17 cells/condition analyzed per experiment. Total N per condition ≥67. Scale bars = 20 μm. *p < 0.05; ***p < 0.001 vs WT; data are presented as mean ± SEM. Statistical significance was determined by two-tailed unpaired t-test.
d, A working model for the paradoxical function of TNFAIP8 in tumor cell proliferation and migration. In migrating cells, TNFAIP8 sensitizes cells to PDGF stimulation to generate more PIP3 (through lipid transfer) and more Rac1-GTP polarization, promoting cell migration. By contrast, in proliferating cells, TNFAIP8 controls hippo activation and decreases YAP nucleus translocation, reducing the rate of cell proliferation.
Isolated mouse eyes were fixed in 3.7% formaldehyde overnight at 4 °C, cryoprotected in 30% sucrose solution for a minimum of 24 h prior to freezing and 20-μm thick cryosections cut. Sections were incubated in 0.25% Triton X-100 in DPBS buffer (2.7 mM KCl, 1.5 mM KH2PO4, 137.9 mM NaCl, 8.1 mM Na2HPO4–7 H2O [Corning, 21-0310CV]) for 10 min, followed by blocking buffer (5% goat serum, 0.5 g BSA in 50 ml DPBS) for 1 h prior to labeling. Samples were incubated sequentially in primary antibody at 4 °C overnight, followed by fluorescent-conjugated secondary antibody for 1 h at 37°C (Jackson ImmunoResearch Laboratories, 111-295-144, 115-545-003, 115-295-008). Primary antibodies used included: …..active Rac1 (NewEast Biosciences, 26903), ….. F-actin was localized with Alexa448-conjugated phalloidin (Invitrogen-Molecular Probes). Nuclei were labeled with TO-PRO-3 (Invitrogen-Molecular Probes).
Immunostaining of tissue
Enucleated human eyes were purchased from Lions Eye Institute for Transplant and Research or Singapore General Hospital. Paraffin sections of 4 µm were used for immunohistochemistry withLeica Bond Polymer Refine detection kit DS9800. Slides were heated for 20 min at 60°C and then loaded onto Leica Bond III autostainer for antigen retrievel using Leica Bond ER2 solution for 20 min at 100°C, antibody incubation follow suit. Primary (1:100) and secondary (1:300) antibodies were diluted in 10% FBS, 0.1% PBS-Tween; and incubated overnight at 4 °C and 1 h at RT, respectively. Vectashield with 40,6-diamidino-2-phenylindole (DAPI) was applied to the tissues and coverslipped. Confocal microscopy was performed with a Leica SP8 confocal microscope.
Immunofluorescence of cells
Cells were grown on glass coverslips and fixed in 4% PFA for 1 h at 4 °C. Cells were blocked in blocking buffer (5% BSA, 0.05% TX-100, PBS) for 1 h at room temperature and incubated overnight in the respective primary antibodies at 4 °C. Cells were then washed 3 times for 15 min with PBS and incubated with fluorescently-tagged secondary antibodies for 1 h at room temperature followed with addition of Vectashield Anti-fade Mounting Medium with DAPI before coverslipped for analysis.
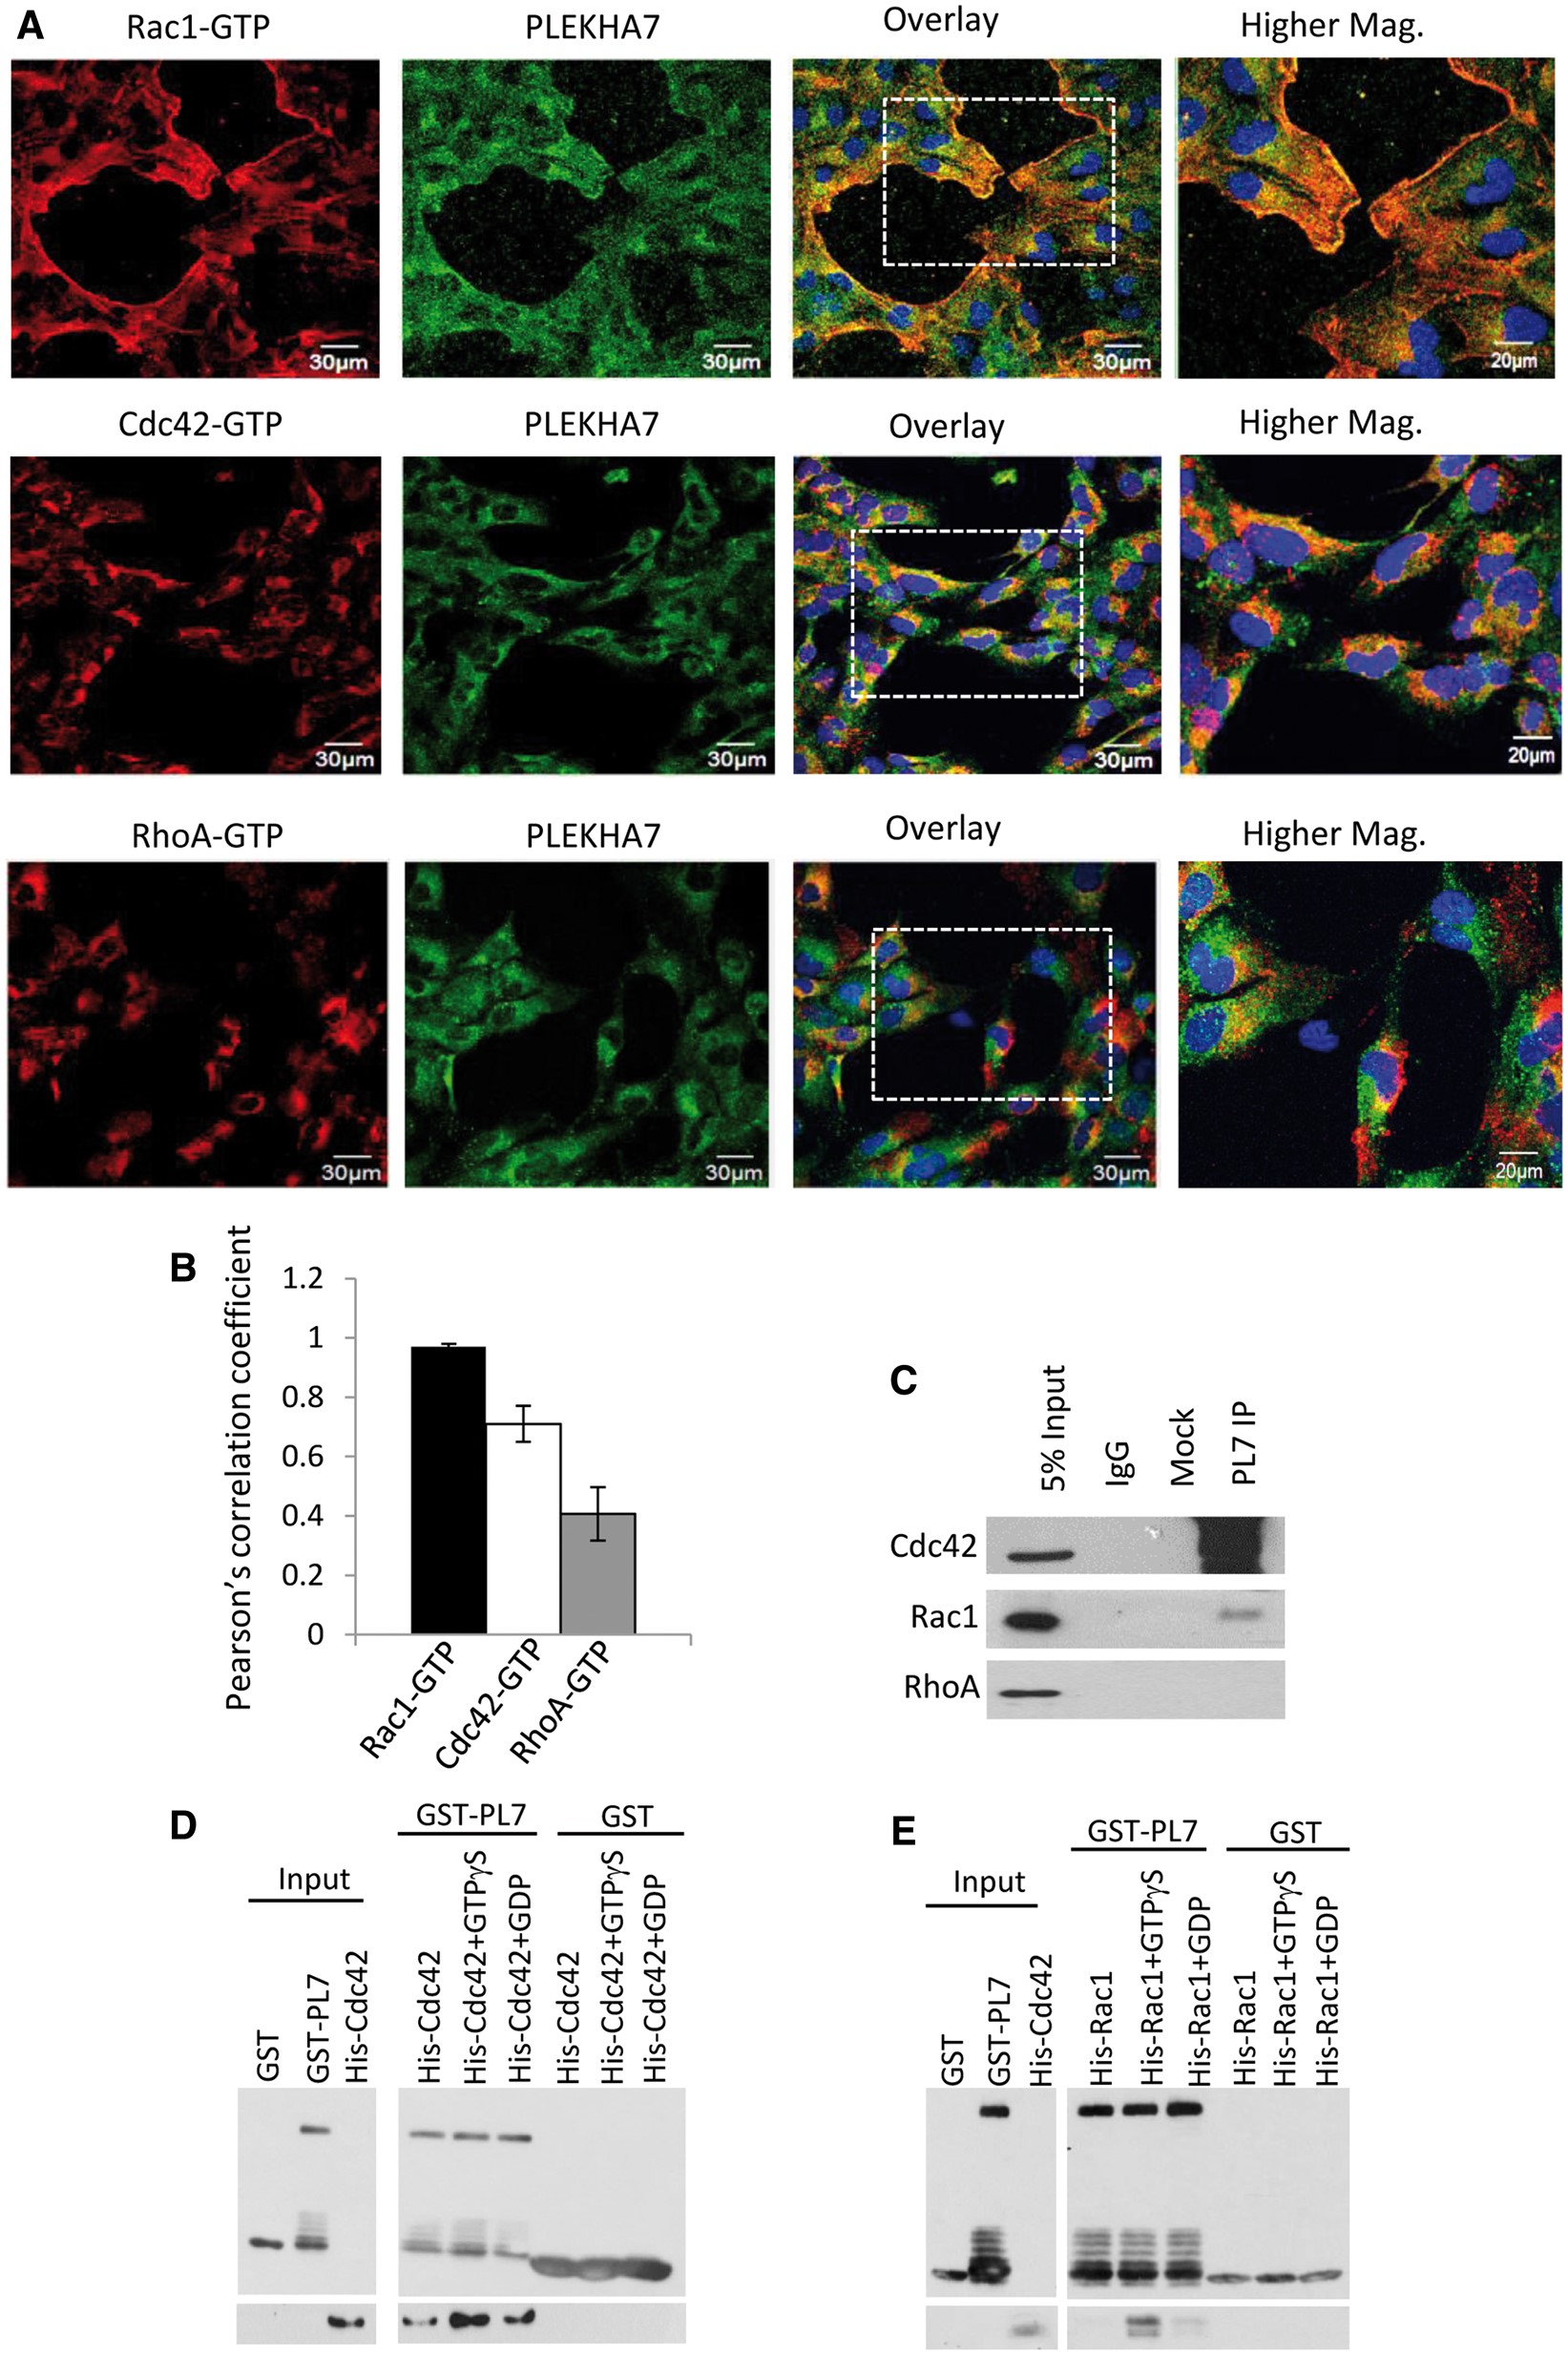
Figure 3
PLEKHA7 is a specific interactor of Rac1 and Cdc42. (A) Representative time-lapse fluorescence microscopy images of h-iNPCE cells during cell migration. Endogenous PLEKHA7 (green), Rac1-GTP (red), Cdc42-GTP (red) and RhoA-GTP (red) were labelled and analysed. Scale 20 μm. (B) The spatial relationship between PLEKHA7 and respective RhoGTPases were analysed with Pearson Pearsonearsonth Pearsoent (all conditions n > 40). Error bars represent ±SEM. Value of 0 denotes no linear correlation while positive values closer to 1 denote positive correlation of protein pair evaluated. (C) PLEKHA7 co-immunoprecipitated with Cdc42 and Rac1 from untransfected h-iNPCE cells. (D,E) In vitro protein binding assays between recombinant proteins. Full-length GST-tagged PLEKHA7 were incubated with either unbound, GTPγS bound or GDP bound His-tagged Cdc42 or Rac1 and analysed by western blot analysis.
Immunostaining of tissue
Enucleated human eyes were purchased from Lions Eye Institute for Transplant and Research or Singapore General Hospital. Paraffin sections of 4 µm were used for immunohistochemistry withLeica Bond Polymer Refine detection kit DS9800. Slides were heated for 20 min at 60°C and then loaded onto Leica Bond III autostainer for antigen retrievel using Leica Bond ER2 solution for 20 min at 100°C, antibody incubation follow suit. Primary (1:100) and secondary (1:300) antibodies were diluted in 10% FBS, 0.1% PBS-Tween; and incubated overnight at 4 °C and 1 h at RT, respectively. Vectashield with 40,6-diamidino-2-phenylindole (DAPI) was applied to the tissues and coverslipped. Confocal microscopy was performed with a Leica SP8 confocal microscope.
Immunofluorescence of cells
Cells were grown on glass coverslips and fixed in 4% PFA for 1 h at 4 °C. Cells were blocked in blocking buffer (5% BSA, 0.05% TX-100, PBS) for 1 h at room temperature and incubated overnight in the respective primary antibodies at 4 °C. Cells were then washed 3 times for 15 min with PBS and incubated with fluorescently-tagged secondary antibodies for 1 h at room temperature followed with addition of Vectashield Anti-fade Mounting Medium with DAPI before coverslipped for analysis.
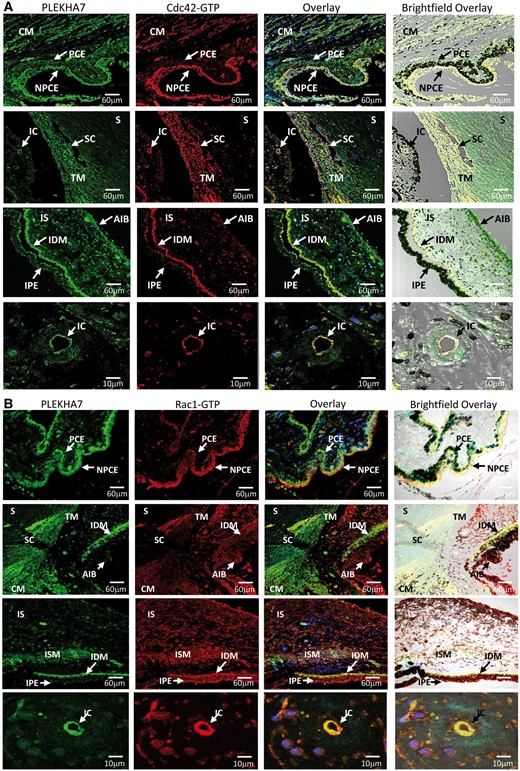
Figure 7
Cdc42-GTP and Rac1-GTP colocalize and interact with PLEKHA7 in PACG-related BAB structures. (A) Coimmunofluorescence of PLEKHA7 (green) with Cdc42-GTP (red) is highly expressed in non-pigmented ciliary epithelium (NPCE) and ciliary muscle (CM) but at moderate levels in pigmented ciliary epithelium (PCE). Partial colocalization of PLEKHA7 with Cdc42-GTP is observed in trabecular meshwork (TM) next to SchlemmKH canal (SC) with no fluorescence detected for both PLEKHA7 and Cdc-42-GTP in sclera (S). PLEKHA7 and Cdc42-GTP was highly expressed in iris dilator muscle (IDM) and at moderate level in iris stroma (IS), anterior iris border (AIB) and iris pigmented epithelium (IPE). When observed with higher magnification power, PLEKHA7 and Cdc42-GTP colocalized strongly in endothelium of iris capillaries (IC). (B) Rac1-GTP (red) coimmunolabelled with PLEKHA7 (green) showed strong immunopositive signals in BAB-related structures such as NPCE, TM, IDM, CM, IC and iris sphincter muscle (ISM).
Immunofluorescence
Mice were anesthetized with 0.2% sodium pentobarbital (5 ml/kg) and perfused intracardially with 30 ml of 4% paraformaldehyde. The brains were fixed in 4% paraformaldehyde overnight at 4 °C and serial coronal sections (30 μm) were then taken throughout the hippocampus using a vibratome. The floating sections were collected and rinsed in a 0.1 M phosphate-buffered saline (PBS) (pH 7.4) solution with 0.1% Triton X-100 and incubated with blocking solution (10% donkey serum and 0.1% Triton X-100) for 2 h at room temperature. The slices were then incubated with the following primary antibodies at 4 °C for overnight: anti-active Rac1 (1:500, mouse), anti-Cleaved Caspase-3 (1:400, rabbit), and anti-phospho-PAK1/2/3 (1:200, rabbit). Following three times rinsed (30 min each) in the PBS solution, slices were incubated with the secondary antibodies conjugated with dyes. Then sections were washed three times with PBS solution and mounted on slides with antifade mounting medium (VECTASHIELD, Cat. No. H-1200). The images of the immunohistochemistry were captured on a Zeiss LSM 710.
Cell counting
Cell counting of c-Fos-positive cells and Rac1-active cells was performed in the CA1 by utilizing imaging analysis function of Zeiss software (Zen blue 2.3). The quantification of the number of c-Fos-positive cells was performed by thresholding c-Fos immunoreactivity above background levels automatically. The quantification of the number of Rac1-GTP cells was performed by setting the threshold manually from 1000 to 4096. The quantification of the number of phospho-PAK cells was performed by setting the threshold manually from 692 to 4096. The quantification of the number of cells with 4′,6-diamidino-2-phenylindole was performed by setting the threshold manually from 616 to 4096.
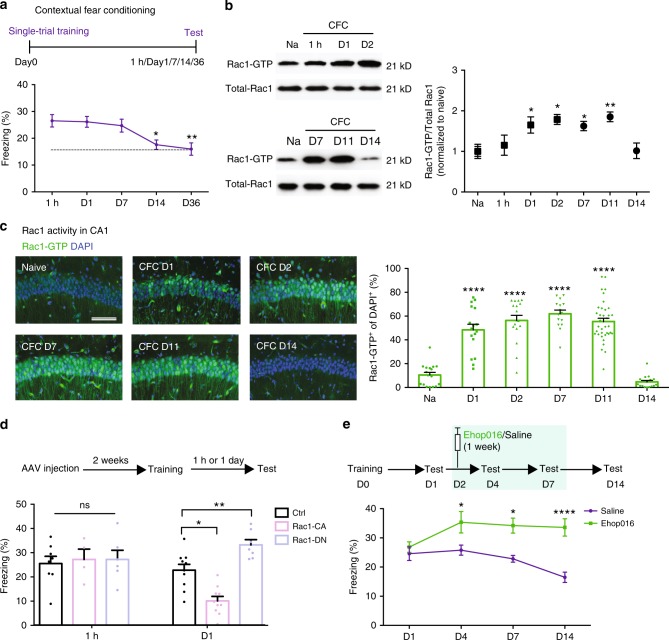
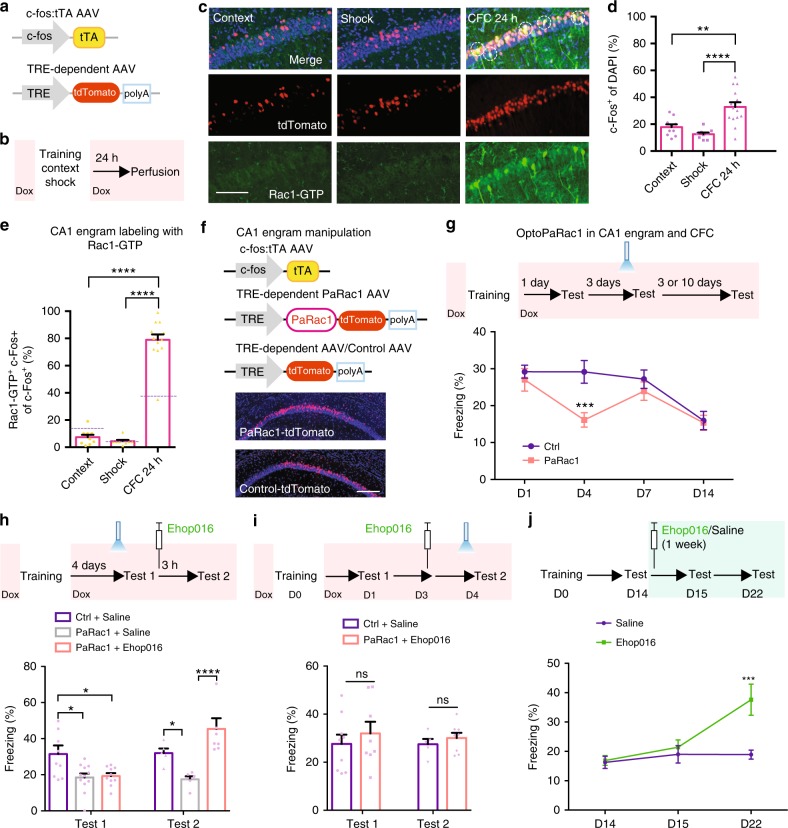
Inhibition of learning-induced Rac1 activity causes memory enhancement. a …. b Representative image of western blottings (left) and data (right) showing total Rac1 levels and Rac1-GTP in hippocampal extracts from naive (Na) and trained (one shock) at various retention intervals (1 h, day 1, day 2, day 7, day 11, or day 14). *P < 0.05 and **P < 0.01 (from one-way ANOVA); n = 12, 7, 7, 3, 4, 4, and 4 mice. c Representative immunostaining of Rac1-GTP (left) and data (right) showing percentages of Rac1-GTP+ cells in the hippocampal CA1 region of Na mice and CFC mice at various periods (day 1, day 2, day 7, day 11, or day 14). Coronal sections of the hippocampal CA1 region of Na mice and CFC mice with the anti-Rac1-GTP (green) and anti-nuclei (blue). Scale bar, 500 μm. ****P < 0.0001 (from one-way ANOVA); n = 15-17 slices from 7 mice for each group. d …. e …..
Immunofluorescence
Mice were anesthetized with 0.2% sodium pentobarbital (5 ml/kg) and perfused intracardially with 30 ml of 4% paraformaldehyde. The brains were fixed in 4% paraformaldehyde overnight at 4 °C and serial coronal sections (30 μm) were then taken throughout the hippocampus using a vibratome. The floating sections were collected and rinsed in a 0.1 M phosphate-buffered saline (PBS) (pH 7.4) solution with 0.1% Triton X-100 and incubated with blocking solution (10% donkey serum and 0.1% Triton X-100) for 2 h at room temperature. The slices were then incubated with the following primary antibodies at 4 °C for overnight: anti-active Rac1 (1:500, mouse), anti-Cleaved Caspase-3 (1:400, rabbit), and anti-phospho-PAK1/2/3 (1:200, rabbit). Following three times rinsed (30 min each) in the PBS solution, slices were incubated with the secondary antibodies conjugated with dyes. Then sections were washed three times with PBS solution and mounted on slides with antifade mounting medium (VECTASHIELD, Cat. No. H-1200). The images of the immunohistochemistry were captured on a Zeiss LSM 710.
Cell counting
Cell counting of c-Fos-positive cells and Rac1-active cells was performed in the CA1 by utilizing imaging analysis function of Zeiss software (Zen blue 2.3). The quantification of the number of c-Fos-positive cells was performed by thresholding c-Fos immunoreactivity above background levels automatically. The quantification of the number of Rac1-GTP cells was performed by setting the threshold manually from 1000 to 4096. The quantification of the number of phospho-PAK cells was performed by setting the threshold manually from 692 to 4096. The quantification of the number of cells with 4′,6-diamidino-2-phenylindole was performed by setting the threshold manually from 616 to 4096.
Regulation of Rac1 activity within CA1 engram cells affects memory maintenance. a–d Strategy of CFC-activated CA1 engram cells labeling with Rac1 activity immunoreactivity. a Diagram of AAV9-c-fos:tTA or AAV9-TRE-tdTomato. b Experimental schedule. c Coronal section of CA1 engram cells (red) labeling with anti-Rac1-GTP (green). Scale bar, 100 μm. Circled cells represent examples of double-positive. d Percentages of engram cells in CA1. **P < 0.01 and ****P < 0.0001 (from one-way ANOVA); n = 10, 9, 14 mice. e Percentages of CA1 engram cells labeling with anti-Rac1-GTP. ……
Histology
Staged embryos were dissected in PBS, and fixed in 4% paraformaldehyde (PFA) in PBS at 4°C. Following overnight fixation, the embryos were dehydrated by gradient ethanol washes and were embedded in paraffin. Samples were sectioned at 10 μm and subjected to standard Hematoxylin/Eosin staining and histological analysis as described (Dong et al., 2019).
In situ Hybridization and Immunohistochemistry
For immunohistochemistry, samples were sectioned at 10 μm and subjected to standard protocols using anti-Rac1-GTP antibody (1:500, NewEast Bio, 26903), anti-cleaved caspase 3 antibody , anti-TH antibody , and Alexa Fluor 594 goat anti-rabbit IgG secondary antibody . For whole-mount immunostaining, E10.5 embryos were dissected and fixed with 4% PFA/PBS overnight. The embryos were then rinsed with PBS three times followed by wash with 0.1% Triton X-100. Following blocking in 5% normal goat serum for 1 h at room temperature, the samples were treated with anti-neurofilament-L for 2 days at 4°C. The immunofluorescence signal was developed with Alexa Fluor 594 goat anti-rabbit IgG secondary antibody . The embryos were then dehydrated with 100% MeOH and cleared with BABB solution (benzyl alcohol: benzyl benzoate at a ratio of 1:2) for imaging.
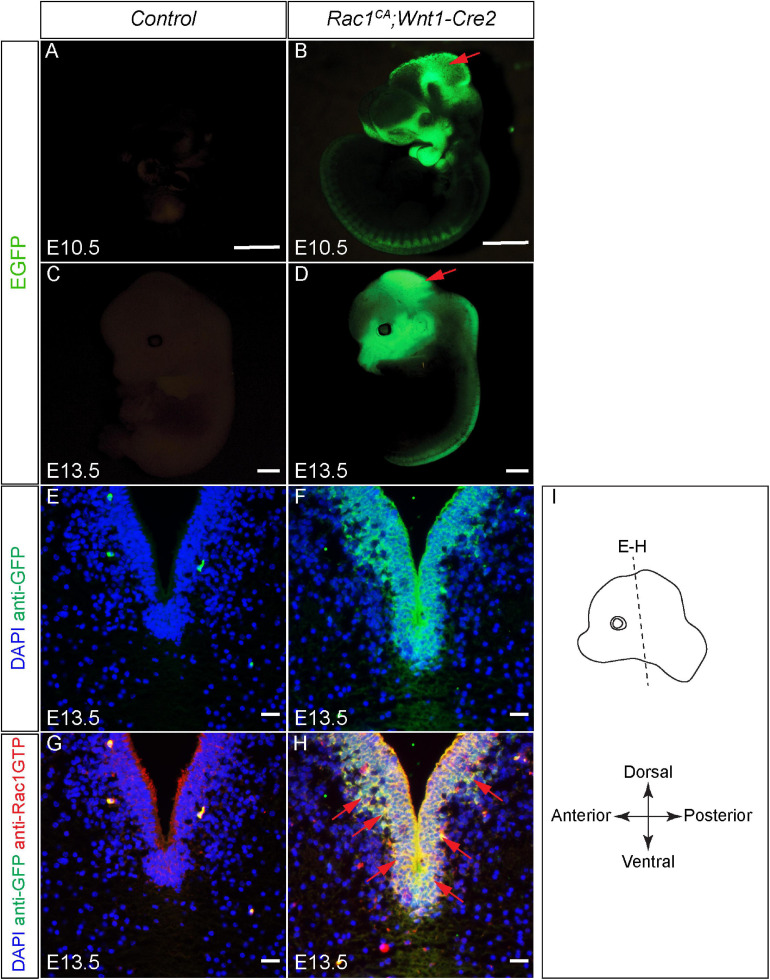
Validation of augmented Rac1 activity in Rac1CA;Wnt1-Cre2 embryos. (A–D) …..(G,H) Co-immunostaining with anti-Rac1-GTP antibody (red) and anti-GFP antibody (green) on coronal sections of E13.5 littermate control (G) and Rac1CA;Wnt1-Cre2 (H) at the level of ventral midbrain. Slides are counterstained with DAPI (blue). Red arrows point to overlapped expression of EGFP and Rac1-GTP. (I) …., 10 μm.
Histology
Staged embryos were dissected in PBS, and fixed in 4% paraformaldehyde (PFA) in PBS at 4°C. Following overnight fixation, the embryos were dehydrated by gradient ethanol washes and were embedded in paraffin. Samples were sectioned at 10 μm and subjected to standard Hematoxylin/Eosin staining and histological analysis as described (Dong et al., 2019).
In situ Hybridization and Immunohistochemistry
For immunohistochemistry, samples were sectioned at 10 μm and subjected to standard protocols using anti-Rac1-GTP antibody (1:500, NewEast Bio, 26903), anti-cleaved caspase 3 antibody , anti-TH antibody , and Alexa Fluor 594 goat anti-rabbit IgG secondary antibody . For whole-mount immunostaining, E10.5 embryos were dissected and fixed with 4% PFA/PBS overnight. The embryos were then rinsed with PBS three times followed by wash with 0.1% Triton X-100. Following blocking in 5% normal goat serum for 1 h at room temperature, the samples were treated with anti-neurofilament-L for 2 days at 4°C. The immunofluorescence signal was developed with Alexa Fluor 594 goat anti-rabbit IgG secondary antibody . The embryos were then dehydrated with 100% MeOH and cleared with BABB solution (benzyl alcohol: benzyl benzoate at a ratio of 1:2) for imaging.
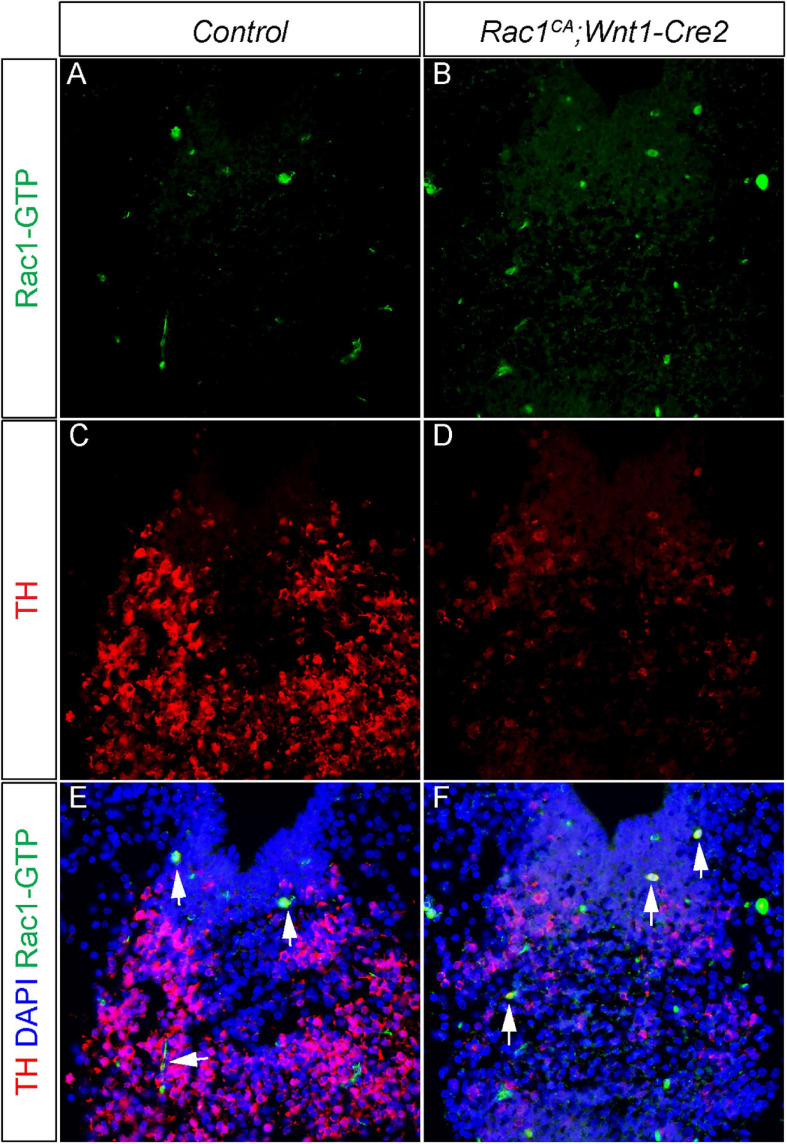
Neural crest driven Rac1G12V expression regulates mDA differentiation in a non-autonomous manner. (A,B) Immunostaining with anti Rac1-GTP antibody (green) on coronal sections of E13.5 littermate control and Rac1CA;Wnt1-Cre2 embryo at the midbrain level. (C,D) Immunostaining with anti TH antibody (red) on same sections of A,B. (E,F) Merged images of A–D with DAPI staining (blue). Blank arrows point to cells express both TH and Rac1-GTP.
Immunohistochemical Staining
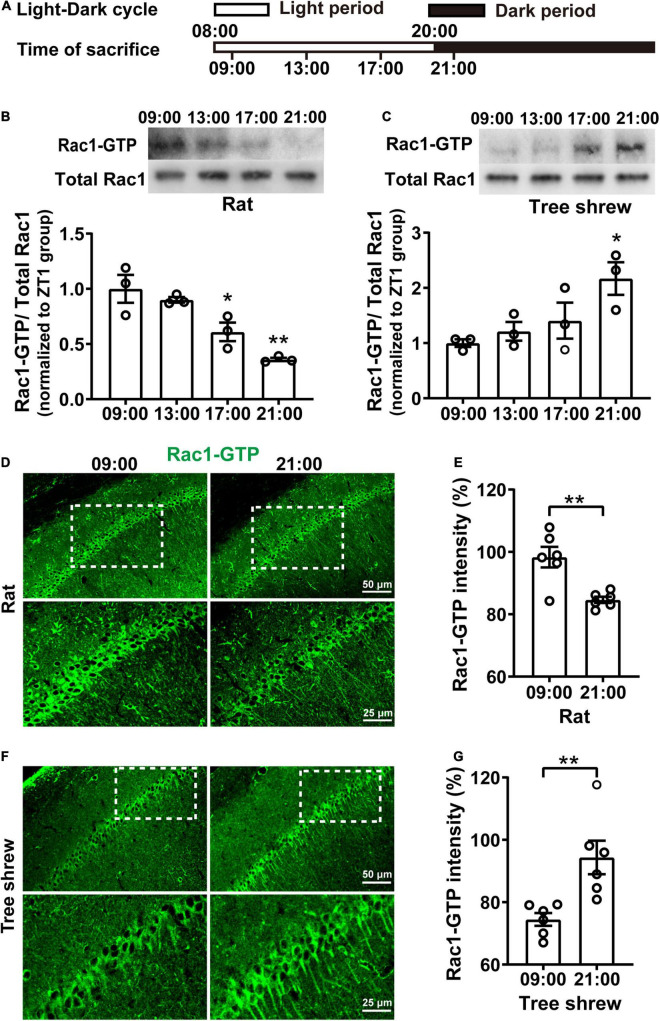
The rats and tree shrews were anesthetized at 09:00 or 21:00 with phenobarbital sodium and perfused with ice-cold 4% paraformaldehyde in 0.01 M phosphate-buffered saline (PBS). The brains were post-fixed for 4h at 4°C and dehydrated in 30% sucrose in 0.01 M PBS. Then, the brains were sectioned (40 μm thick coronal sections) using a cryostat and stored in PBS. Following that, Rac1-GTP immunostaining was performed; free-floating sections were placed in a 0.01 M PBS solution containing 5% BSA and 0.3% Triton X-100 for 1 h, followed by incubation with primary antibody mouse anti-active Rac1, i.e., Rac1-GTP (NewEast, 26903, 1:800 dilution) overnight at 4°C, then washed slices three times in PBS, followed by 2 h of incubation with secondary antibody (Donkey anti-mouse Alexa-488, Invitrogen, A21202, 1:1000 dilution) at room temperature. The slices were subsequently washed three times, followed by mounting and cover-slipping on microscope slides. Images were captured using a confocal microscope (Olympus, FV3000) with a 20×objective at the same settings for all conditions.
Immunohistochemistry Data Analysis
Quantification of immunohistochemical staining of Rac1-GTP was performed in the pyramidal neurons of CA1 by utilizing the imaging analysis function of ImageJ software (Jensen, 2013). The integrated intensity quantification of Rac1-GTP was performed by setting the threshold manually from 30 to 255. Two coronal brain sections per animal were quantified at two different bregma levels (−3.24 and −3.36 mm), and quantitative analysis was obtained at 20× magnification.
Rac1 activity in the hippocampus shows fluctuates oppositely in nocturnal rats and diurnal tree shrews during the daytime. (A) Diagram for experimental procedures. The light was turned on at 08:00 and turned off at 20:00. Rats and tree shrews were sacrificed at 09:00, 13:00, 17:00, or 21:00. (B) Rac1 activity in the hippocampus shows gradually decreased from 09:00 to 21:00 in rats. Upper panel: representative WB demonstrated that Rac1 activity sharply decreased at the 17:00 and 21:00 groups compared with the 09:00 group. Lower panel: statistical bar graph showed an obvious inhibition of Rac1-GTP in the 17:00 group and 21:00 group compared with the 09:00 group. (C) Rac1 activity in the hippocampus shows gradually increased from 09:00 to 21:00 in tree shrews. Upper panel: representative WB demonstrated that Rac1 activity remarkably increased in the 21:00 group compared with the 09:00 group. Lower panel: statistical bar graph showed an obvious increase of Rac1-GTP in the 21:00 group compared with the 09:00 group. (D) Representative images of IHC for Rac1-GTP in rats. (E) The statistical bar graph showed that the integrated density of Rac1-GTP in the CA1 area was significantly decreased in the 21:00 group compared with the 09:00 group. (F) Representative images of IHC for Rac1-GTP in tree shrews. (G) The statistical bar graph showed that the integrated density of Rac1-GTP in the CA1 area was significantly increased in the 21:00 group compared with the 09:00 group. Data are presented as mean ± SEM, *p < 0.05, **p < 0.01.
Immunohistochemical analyses.
Hippocampal slices that received TBS, together with paired control slices from the same mice, were collected at specified poststimulation time points to evaluate dendritic spine levels of GTP-bound (activated) Rac1 or phosphorylated (p) PAK (Ser141), respectively. Specifically, double-immunolabeling for pPAK and the postsynaptic scaffold protein PSD95 or for Rac1-GTP and cofilin was performed (Chen et al., 2007). Cofilin was used as a spine marker in combination with localization of Rac1-GTP because the antisera are raised in different species and our work has shown that cofilin is highly localized within hippocampal dendritic spines (Chen et al., 2007). For experiments evaluating basal levels of PAK, adult mouse brains were fast-frozen in 2-methyl butane (−45°C) and cryostat sectioned on the coronal plane at 20 μm. The slide-mounted tissue was fixed in −20°C methanol for 15 min and processed for dual immunohistochemical localization of PAK3 and PSD95. Primary antisera used included mouse anti-PSD95 (1:1000), rabbit anti-cofilin (1:250), mouse anti-Rac1-GTP (1:1000, #26903, NewEast Biosciences), rabbit anti-phospho-PAK1,2,3 Ser141 (1:100; #44-940G), and rabbit anti-PAK3 (1:500; #06-902). Alexa 488 anti-mouse IgG and Alexa 594 anti-rabbit IgG (Invitrogen) were used for visualization.
TBS fails to activate Rac1 in Fmr1-KO hippocampal spines. A, Photomicrographs show immunoreactivity for Rac1-GTP (green) and cofilin (red; spine marker), and merged image, in CA1 str. radiatum of a WT, control hippocampal slice. As shown, activated Rac1 is localized to a subpopulation of cofilin-labeled spines. Scale bar, 5 μm. B, Quantitative analysis shows the effect of TBS on Rac1-GTP+ spines in the two genotypes (levels normalized to respective genotype low-frequency stimulation controls; n = 9–11 slices/group). As shown, TBS increased the number of Rac1-GTP+ spines in slices from WT but not Fmr1-KO mice. **p < 0.001, one-tailed Student’s t test; planned comparison.
Analysis of Rac1 activity
Fig 3
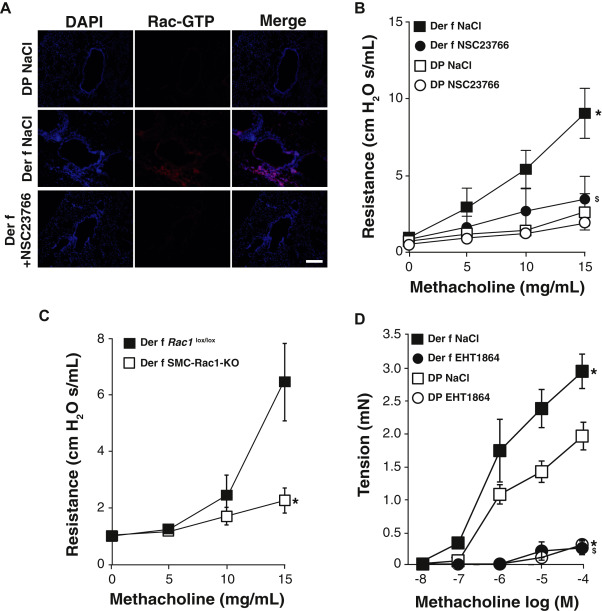
AHR is dependent of Rac1 activity in murine allergic asthma model. A, Representative images of Rac1-GTP immunofluorescence in lung sections from naive (DP) and Der f–sensitized (Der f) mice treated with NSC23766 or vehicle (NaCl) nebulization (n = 5-7). Nuclei were detected by DAPI staining. Scale bar, 100 μm. B, ……
Analysis of Rac1 activity
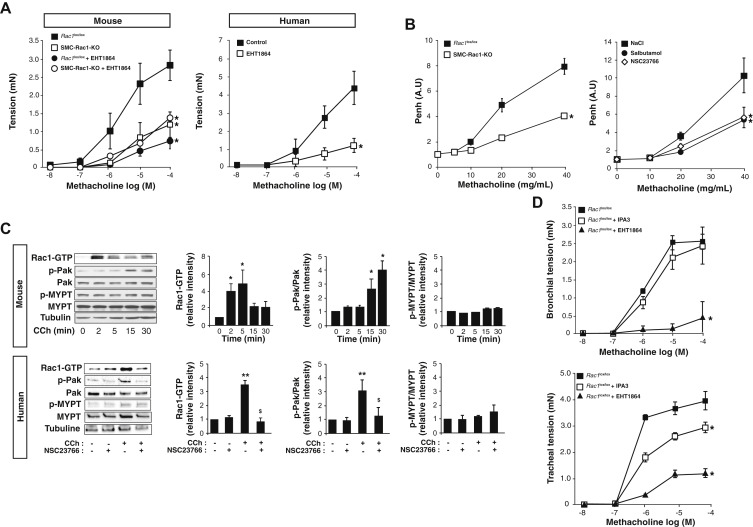
Fig 1 Rac1 controls human and murine aSMC contraction.
A, ….C, Immunoblot analysis and quantification of Rac-GTP, Pak, and MYPT expression and phosphorylation at different time of CCh stimulation in murine aSMCs (upper panel) and after 5 minutes of CCh stimulation in human aSMCs preincubated or not with NSC23766 for 1 hour (lower panel). Corresponding quantifications are displayed on the right of the blots (n = 3). D, ….
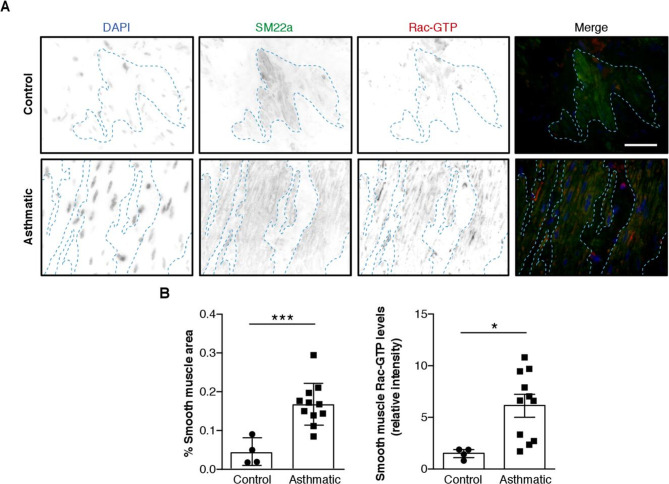
Rac1 activity is increased in aSMC from patients with severe asthma
PMID: 25209090 - miRNA-17 members that target Bmpr2 influence signaling mechanisms important for embryonic stem cell differentiation in vitro and gastrulation in embryos
Rac1 activity is increased in aSMC from patients with severe asthma
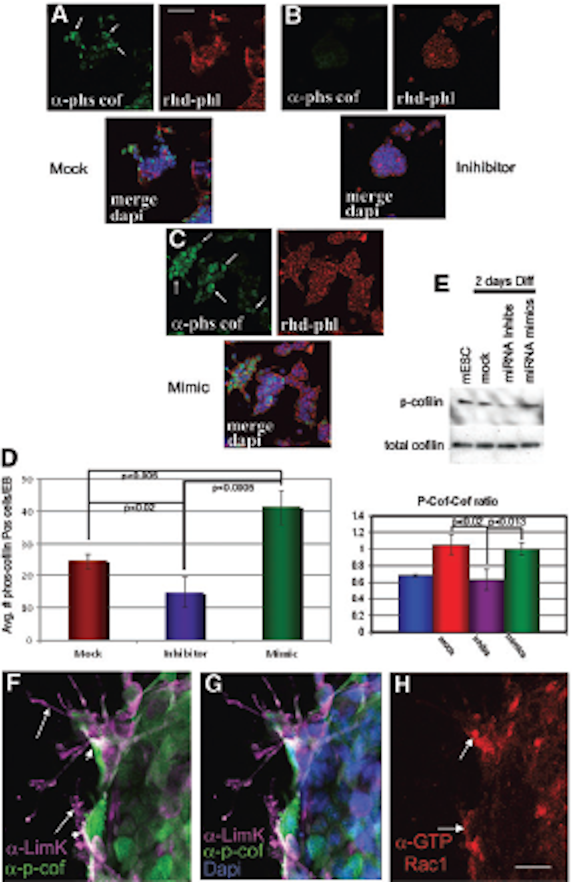
FIG. 9. ….. (H) Using an antibody di-rected against the active form of Rac1, a down-stream target of p-cofilin, active Rac1 is highly expressed in the same differentiating cells as LIMK and p-cofilin. Scale bar in H = 10 mmin F–H. p-cofilin, phosphorylated cofilin; LIMK, Lin11, Isl-1 and Mec-3 kinase. Color images available online at www.liebertpub.com/scd
Rac1 activity is increased in aSMC from patients with severe asthma
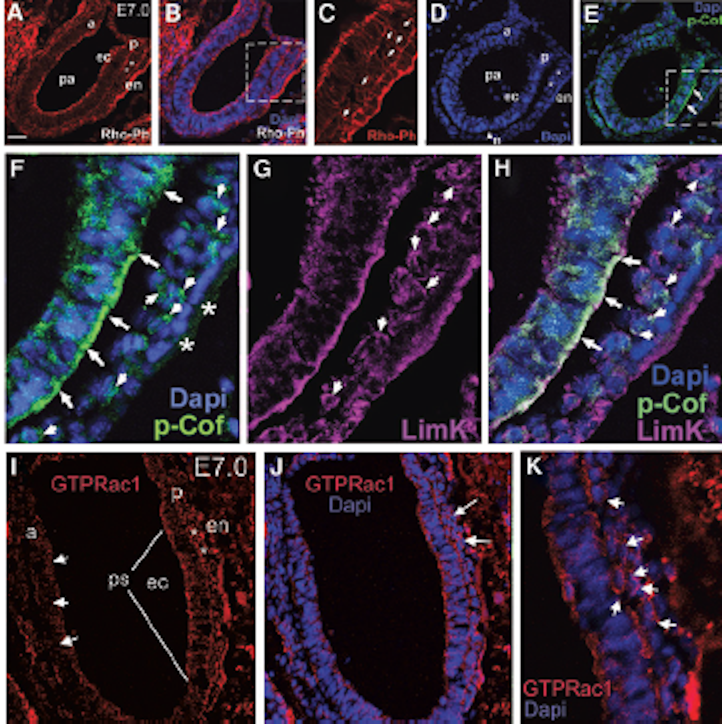
FIG. 10. LIMK colocalizes with p-cofilin in cells under-going gastrulation in E7.0 embryos. ……(I–K) Anti-GTP-bound Rac1 reveals for the first time the localization of active Rac1 at the membranes of mesoderm cells where LIMK and p-cofilin are detected. Color images available online at www.liebertpub.com/scd
Western Blotting Analysis
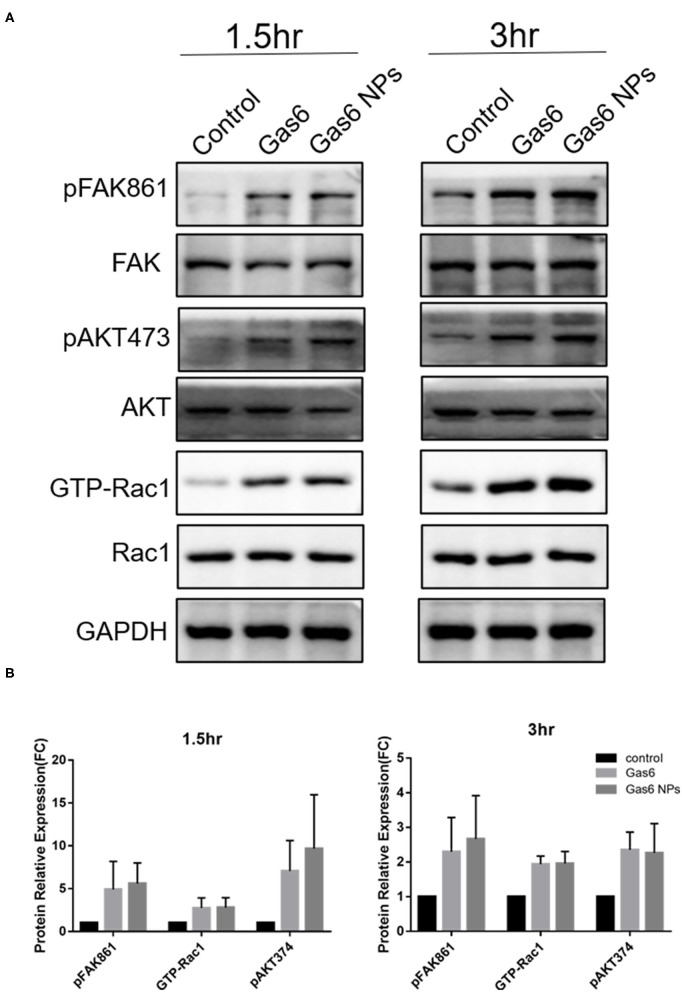
The hfRPE cells were plated at a density of 5 × 10⁵ cells/well into poly-l-lysine coated 6-well plates and allowed to adhere overnight. Cells were then pretreated with Gas6 NPs dispersion (final concentration of Gas6 was 500 ng/mL) or recombinant Gas6 protein (final concentration 500 ng/mL) for 1 h. Thereafter, 15 μL of 1 μm fluorescein isothiocyanate (FITC)-labeled carboxylate-modified microspheres (1933365; 1:10 dilution; Invitrogen, USA) was added, and incubated for 1.5 h and 3 h at 37°C with a 5% CO2 atmosphere. Thereafter, proteins were extracted from cells and their total concentration was measured using a BCA Protein Assay Kit (CWBIO) according to the manufacturer’s instructions. Equal quantities (40 μg) of proteins per gel lane were separated on 10% polyacrylamide gels by sodium dodecyl sulfate–polyacrylamide gel electrophoresis (SDS-PAGE) and then transferred to polyvinylidene fluoride membranes using an electroblotting apparatus (Bio-Rad). Membranes were blocked using a solution containing 5% non-fat milk and TBS-Tween20 and then incubated separately at 4°C overnight with the following primary antibodies: GAPDH (sc-25778; 1:1000), active GTP-Rac1 (26903; 1:200; Neweast Biosciences), Rac1 (ab155938; 1:600), p-FAK861 (44-626G; 1:800), FAK (AHO0502; 1:200), p-AKT473 (4060s; 1:500), and AKT (9272; 1:500). Membranes were then incubated with horseradish-peroxidase (HRP)-conjugated secondary antibody (goat anti-mouse/rabbit IgG antibody; G21240/G21234; 1:1000) for 1 h at room temperature. Membranes were then washed 3 times (10 min per wash) with 0.1% TBS-Tween20 after each antibody application. Thereafter, immuno-labeled proteins were detected using the ECL Plus Detection System (Invitrogen) according to the manufacturer’s instructions. The band was analyzed using Image-Pro Plus (IPP) software.
Western blot analysis of the key proteins involved in Gas6 induced phagocytosis. (A) Relative optical density determined by densitometry using ImageJ software. (B) Protein relative expression in control, Gas6 and Gas6 NPs groups. The data are expressed as mean ± SD.
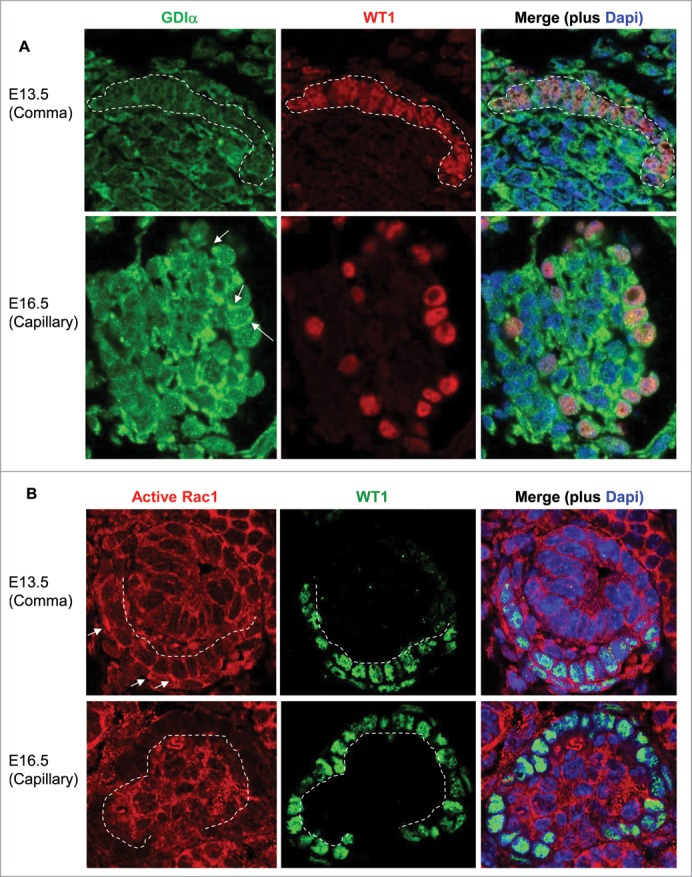
Immunohistochemistry of the kidney
Kidneys were isolated from embryonic mice at E13.5 and E16.5, fixed in 100% methanol for 30 minutes at -20C, paraffin embedded and sliced to give rise to 4 mm thick sections. Citrate treatment was performed for antigen retrieval. Sections were stained with RhoGDIa antibody (1: 50) and Alexa Fluor 488 anti-rabbit IgG (1: 1000) . WT1 was visualized using the WT1 antibody (1: 200) and either Alexa Fluor 555 anti-mouse IgG (1: 1000) ( 4409) or Alexa Fluor 488 anti-rabbit IgG (1: 1000) ( 4412). Nuclei were stained with Dapi (1: 500) (Invitrogen, D1306). Finally, sections were stained using anti-active Rac1-GTP antibody (1: 50) (NewEast Biosciences, 26903) and Alexa Fluor 555 anti-mouse IgG (1: 1000) ( 4409). A Zeiss Axiphot microscope was used to take the photographs at 60x magnification.
Immunostaining on cell cultures
Xenopus NC cells were cultured on Fibronectin-coated dishes, left to migrate for a few hours, then fixed in PFA 4% for 30 min, blocked and permeabilized in PBS1X/2%serum/0.1%Triton for 30 min and incubated 2 h at room temperature or overnight at 4 °C with a primary antibody, washed in PBS and incubated 1 hour at room temperature or overnight at 4 °C with a secondary antibody mixed with DAPI or Phalloidin if necessary. Primary antibodies: rabbit anti-Phospho-Paxillin Tyr118 (Upstate, 07–733; 1/200), mouse anti-Rac1-GTP (NewEast, 26903; 1/500). Secondary antibodies: goat anti-rabbit Alexa-488 or 555, goat anti-mouse IgM-594 (Invitrogen; all used 1/1000). Counterstaining was done with DAPI and Phalloidin coupled with Alexa-488, 555 or 633 (all diluted 1/1000).
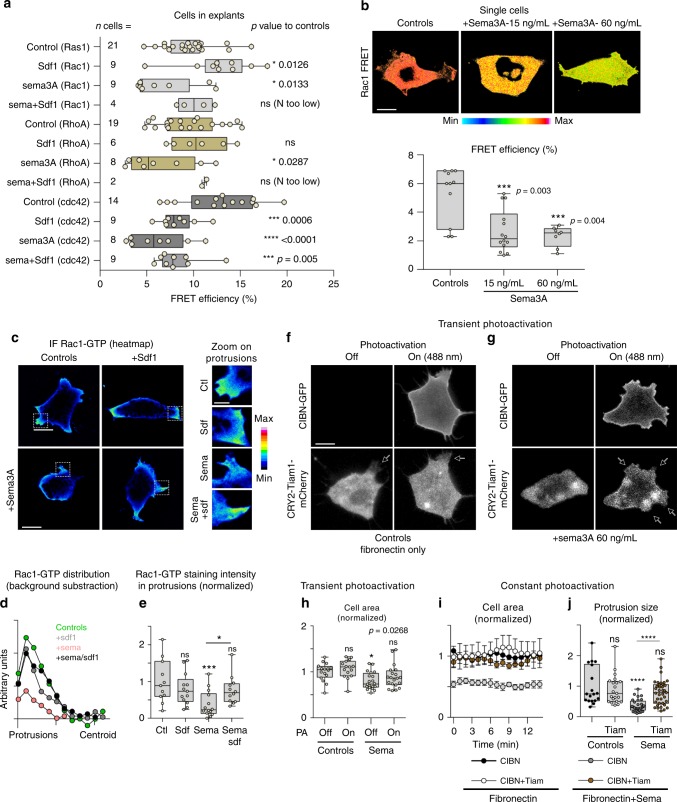
a … c Immunofluorescence against Rac1-GTP. d Distribution of rac1 intensity from cell protrusions to cell centroid. Rac1 staining intensity in the cell centroid was measured in each condition and subtracted from each data set, n = 50 cells from one experiment. e Rac1 staining intensity in protrusions for each experimental condition, n = 50 protrusions from one experiment, ANOVA, followed by multiple comparisons; *p < 0.05; ***p < 0.001. f ……
Immunoblotting and immunoprecipitation
For immunoblotting, polypeptides were resolved by SDS–PAGE and transferred to a PVDF membrane (Bio-Rad). Membranes were blocked with 5% non-fat dry milk, and probed with the indicated antibodies. HRP-conjugated goat secondary antibodies were used (1:10,000, Invitrogen). Immunodetection was achieved with the Hyglo chemiluminescence reagent (Denville Scientific), and detected by a Fuji ECL machine (LAS-3000). For co-immunoprecipitation, cells were lysed in 1% NP40 lysis buffer (25 mM Tris pH 7.5; 300 mM NaCl, 1 mM EDTA, 1% NP40), supplemented with a complete protease inhibitor cocktail (Roche). After preclearing with protein A/G agarose beads for 1 hr at 4 °C, whole-cell lysates were used for immunoprecipitation with the indicated antibodies. Generally, 1–4 μg commercial antibody was added to cell lysate, which was incubated at 4 °C for 8–12 h. After addition of protein A/G agarose beads, incubation was continued for another 2 h. Immunoprecipitates were extensively washed with NP40 lysis buffer and eluted with SDS–PAGE loading buffer by boiling for 5 min before resolution by SDS–PAGE.
(a) Rac-1 activation by UVRAGFS. Western blot shows a pull-down experiment to detect GTP-bound Rac1 in SW480.UVRAGFS cells and on drug treatment. Histogram shows quantification from three independent experiments. (b) ….
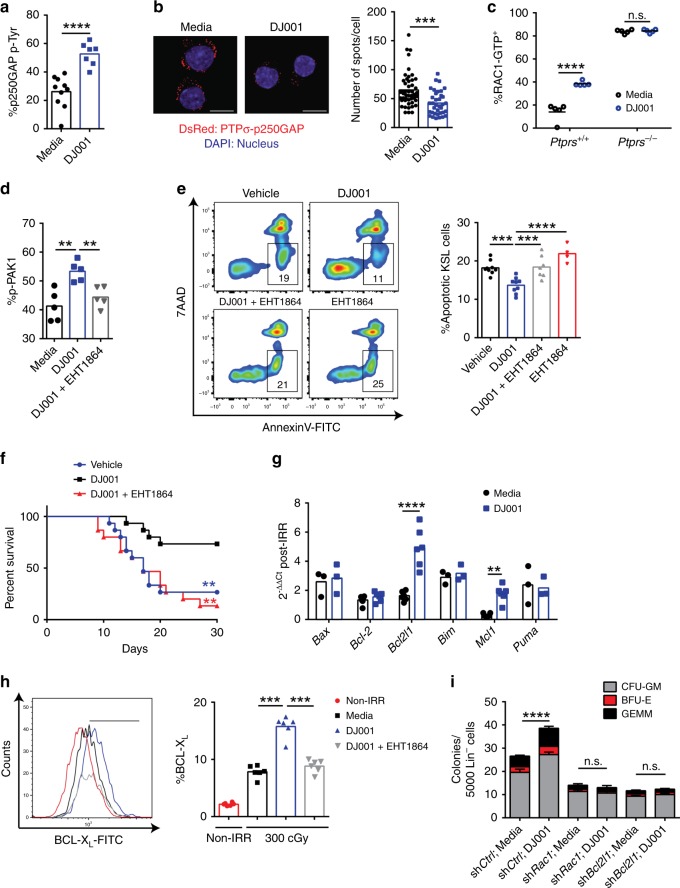
PMC6694155 - PTPσ inhibitors promote hematopoietic stem cell regeneration
Flow cytometric analysis
Intracellular flow cytometric analysis was performed on irradiated (300 cGy) or non-irradiated, sorted KSL cells after treatment with 1 μg/mL DJ001 or control (equal volumes of DMSO) for 24 h. At 24 h after irradiation, cells were fixed with 4% PFA for 10 min, followed by permeabilization using 0.25% saponin in PBS. Cells were washed again and stained with antibody at the recommended concentrations for 30 min at RT. Intracellular antibodies and phospho-flow antibodies used were as follows: FITC-conjugated anti-BCL-XL (Abcam, #26148, 1:100), active RAC1-GTP antibody (NewEast Biosciences, #26903, 1:100) and anti-PAK1 (phospho S144) + PAK2 (phospho S141) + PAK3 (phospho S154) antibody (Abcam, #40795, 1:100), and FITC-conjugated goat anti-rabbit IgG H&L (Abcam, #97050, 1:200).
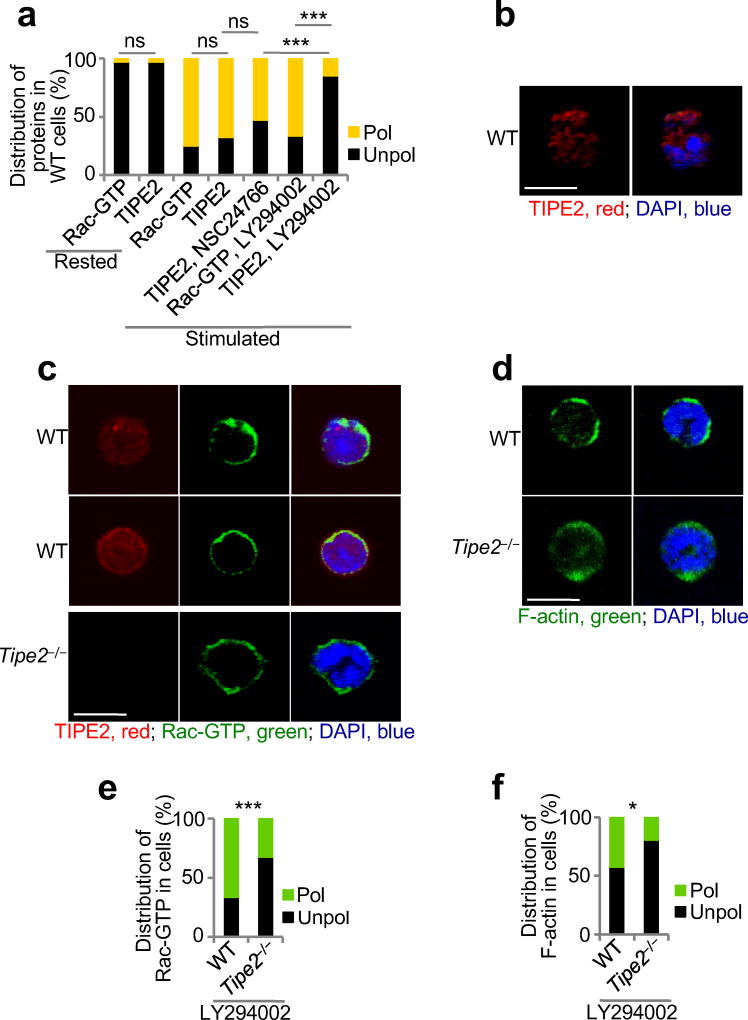
Immunofluorescence analysis and confocal microscopy of fixed neutrophils
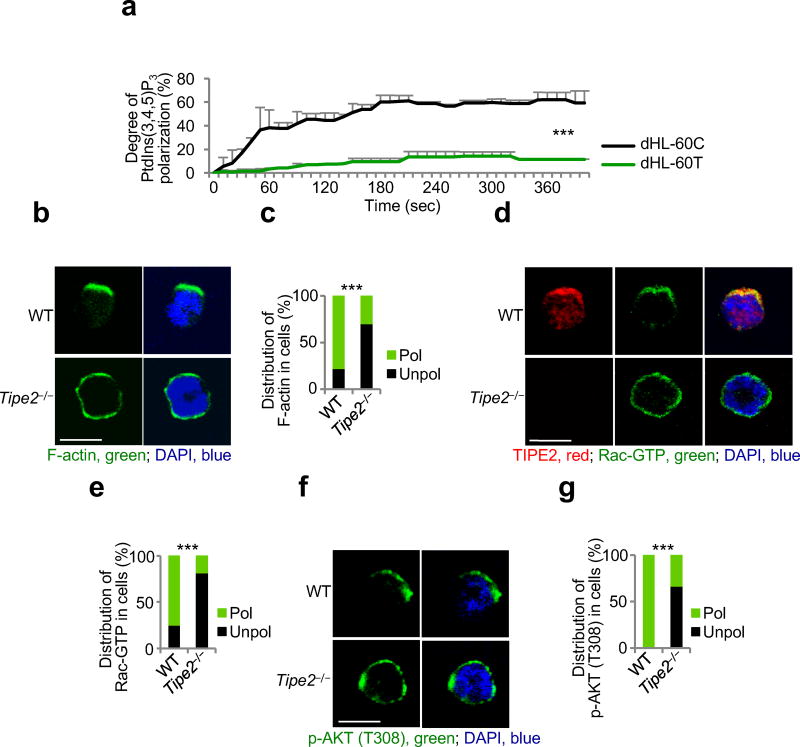
BMNs, dHL-60C, dHL-60T, TIPE2-expressing and 15/16Q-expressing dHL-60T cells were rested for 1 h in HBSS containing 0.1% BSA. Then cells were subjected to point-source stimulation with CXCL2 or CXCL8 at 1 µg/ml for 2.5 min at 37 °C33. In several experiments before stimulation with chemoattractants, BMNs and dHL-60 were pretreated with vehicle, Rac inhibitor (NSC24766, 200 µM, Tocris) or with PI(3)K inhibitor (LY29004, 25 µM, Cell Signaling Technology) for 30 min. After stimulation, cells were fixed with 3% paraformaldehyde in Phosphate-Buffered Saline (PBS) for 15 min at 37 °C, permeabilized in PBS containing 0.1 % Triton X-100 and 3% BSA for 10 min at 25 °C and blocked with PBS containing 5% normal goat serum and 3% BSA for 1 h at 25 °C. BMNs and dHL-60 cells were stained overnight at 4 °C with Phalloidin-AlexaFluor 555 (Cell Signaling Technology) in 3% BSA. Alternatively, they were first incubated overnight at 4 °C with anti-pAKT(T308) (Cell Signaling Techology), anti-TIPE2 (Proteintech), or anti-Rac-GTP (NewEast Biosciences) in 3% BSA, and then for 1 h at 25 °C with secondary anti-rabbit IgG Fab-AlexaFluor 555, anti-rabbit IgG Fab-AlexaFluor 555, or anti-mouse IgM Fab-Alexa Fluor 488 (ThermoFisher Scientific) in 3% BSA. Isotype-matched Igs, PI(3)K inhibitor-treated cells, and Rac inhibitor-treated cells were used as staining controls. Slides were dried and covered with ProLong Gold with DAPI (Invitrogen). Images were acquired on a Zeiss LSM 510 NLO/META and Zeiss LSM 710 confocal microscope and analyzed using LSM Image Browser, Zen lite (Zeiss), and ImageJ software. All images shown are representatives of at least two independent experiments. Thirty to 120 cells of each type and condition were analyzed. Cell polarization was evaluated as described above. Results are presented as the percentages of cells of each genotype with polarized or unpolarized distributions. The statistical significance of the results was evaluated by X2 test. For F-actin polarization, results are also presented as the degree of chemoattractant-induced F-actin polarization, which is the difference in the percentage of polarized cells before and after stimulation with chemoattractant. Student’s t-test was used to assess the statistical significance of these results. To study the spreading of wild-type and Tipe2−/− BMNs, more than thirty cells of each type and condition were measured. The spreading value of the resting wild-type BMNs was set to 1. The statistical significance of results was evaluated by Mann-Whitney U test.
(a) Time-lapse confocal microscopy for PtdIns(3,4,5)P3 distribution in control dHL-60C and TIPE2-deficient dHL-60T neutrophils subjected to point-source stimulation with CXCL8 over the indicated times. The PtdIns(3,4,5)P3 distribution was probed with eGFP-GRP1-PH domain; results are presented as degree of PtdIns(3,4,5)P3 polarization. Values represent means ± SD. The experiments were repeated two times, n ≥ 45. (b-g) Confocal microscopy for the indicated molecules in wild-type (WT) and Tipe2−/− bone marrow neutrophils subjected to point-source stimulations with CXCL8. Panels b, d and f show representative images of each cell types (scale bars are 5 µm), whereas panels c, e, and g show the percentages of cells with polarized (pol) or unpolarized (unpol) distributions of the indicated molecules in each cell type. The experiments were repeated three times, n ≥ 30. ***, P < 0.0001.
Immunofluorescence analysis and confocal microscopy of fixed neutrophils
BMNs, dHL-60C, dHL-60T, TIPE2-expressing and 15/16Q-expressing dHL-60T cells were rested for 1 h in HBSS containing 0.1% BSA. Then cells were subjected to point-source stimulation with CXCL2 or CXCL8 at 1 µg/ml for 2.5 min at 37 °C33. In several experiments before stimulation with chemoattractants, BMNs and dHL-60 were pretreated with vehicle, Rac inhibitor (NSC24766, 200 µM, Tocris) or with PI(3)K inhibitor (LY29004, 25 µM, Cell Signaling Technology) for 30 min. After stimulation, cells were fixed with 3% paraformaldehyde in Phosphate-Buffered Saline (PBS) for 15 min at 37 °C, permeabilized in PBS containing 0.1 % Triton X-100 and 3% BSA for 10 min at 25 °C and blocked with PBS containing 5% normal goat serum and 3% BSA for 1 h at 25 °C. BMNs and dHL-60 cells were stained overnight at 4 °C with Phalloidin-AlexaFluor 555 (Cell Signaling Technology) in 3% BSA. Alternatively, they were first incubated overnight at 4 °C with anti-pAKT(T308) (Cell Signaling Techology), anti-TIPE2 (Proteintech), or anti-Rac-GTP (NewEast Biosciences) in 3% BSA, and then for 1 h at 25 °C with secondary anti-rabbit IgG Fab-AlexaFluor 555, anti-rabbit IgG Fab-AlexaFluor 555, or anti-mouse IgM Fab-Alexa Fluor 488 (ThermoFisher Scientific) in 3% BSA. Isotype-matched Igs, PI(3)K inhibitor-treated cells, and Rac inhibitor-treated cells were used as staining controls. Slides were dried and covered with ProLong Gold with DAPI (Invitrogen). Images were acquired on a Zeiss LSM 510 NLO/META and Zeiss LSM 710 confocal microscope and analyzed using LSM Image Browser, Zen lite (Zeiss), and ImageJ software. All images shown are representatives of at least two independent experiments. Thirty to 120 cells of each type and condition were analyzed. Cell polarization was evaluated as described above. Results are presented as the percentages of cells of each genotype with polarized or unpolarized distributions. The statistical significance of the results was evaluated by X2 test. For F-actin polarization, results are also presented as the degree of chemoattractant-induced F-actin polarization, which is the difference in the percentage of polarized cells before and after stimulation with chemoattractant. Student’s t-test was used to assess the statistical significance of these results. To study the spreading of wild-type and Tipe2−/− BMNs, more than thirty cells of each type and condition were measured. The spreading value of the resting wild-type BMNs was set to 1. The statistical significance of results was evaluated by Mann-Whitney U test.
(a-f) Confocal microscopy for subcellular distribution of TIPE2 (a-c), Rac-GTP (a,c,e) and F-actin (d,f) in wild-type (WT) and Tipe2−/− bone marrow neutrophils, which were rested or stimulated with CXCL8 (point source), with or without pretreatments with Rac inhibitor (NSC24766) (a,b) or PI(3)K inhibitor (LY294002) (a,c-f). Panels a, e and f show the percentages of cells with polarized (pol) or unpolarized (unpol) distributions of the indicated molecules, whereas panels b-d show representative images (scale bars are 5 µm). ns, not significant. The experiments were repeated at least two times; a, e-f, n ≥ 30. *, P < 0.05; ***, P < 0.001; ns, not significant.
Cell culture
Human tongue squamous carcinoma cell line SAS, which was first established from a 69-yr-old female patient by Takahashi et al (1989), was obtained from American Type Culture Collection. In addition, the cell lines shown in the Supplementary Figures include human tongue squamous cancer cell lines SCC-25 and CAL-27, human cervical cancer cell lines SiHa and HeLa, human prostate cancer cell line DU145, human breast cancer cell line Hs578T, and canine kidney epithelial MDCK cell line. All cells were maintained in DMEM supplemented with 10% fetal bovine serum (Invitrogen) and cultured at 37°C in a humidified atmosphere of 5% CO2 and 95% air.
Immunofluorescence staining
The cells on glass coverslips were fixed with phosphate-buffered saline containing 4% paraformaldehyde for 30 min and then permeabilized with 0.1% Triton X-100 for 15 min at room temperature. The fixed cells were stained with primary antibodies at room temperature for 2 h and then incubated with Alexa Fluor 488– or Alexa Fluor 546–conjugated secondary antibodies for 2 h. The primary antibodies used in this study are as follows: anti-vimentin (V9) (1:200), anti-Rac1-GTP (1:200), anti-E-cadherin (1:250), and anti-Tiam1 (1:50). Coverslips were mounted in DAPI Fluoromount-G (Southern Biotech). The images were acquired using a Zeiss Axio Imager M2 microscopy system equipped with a Plan Apochromat 10×/NA 1.4 or 20×/NA 1.4 immersion objective and a camera (ORCA-Flash 4.0 V2; Hamamatsu).
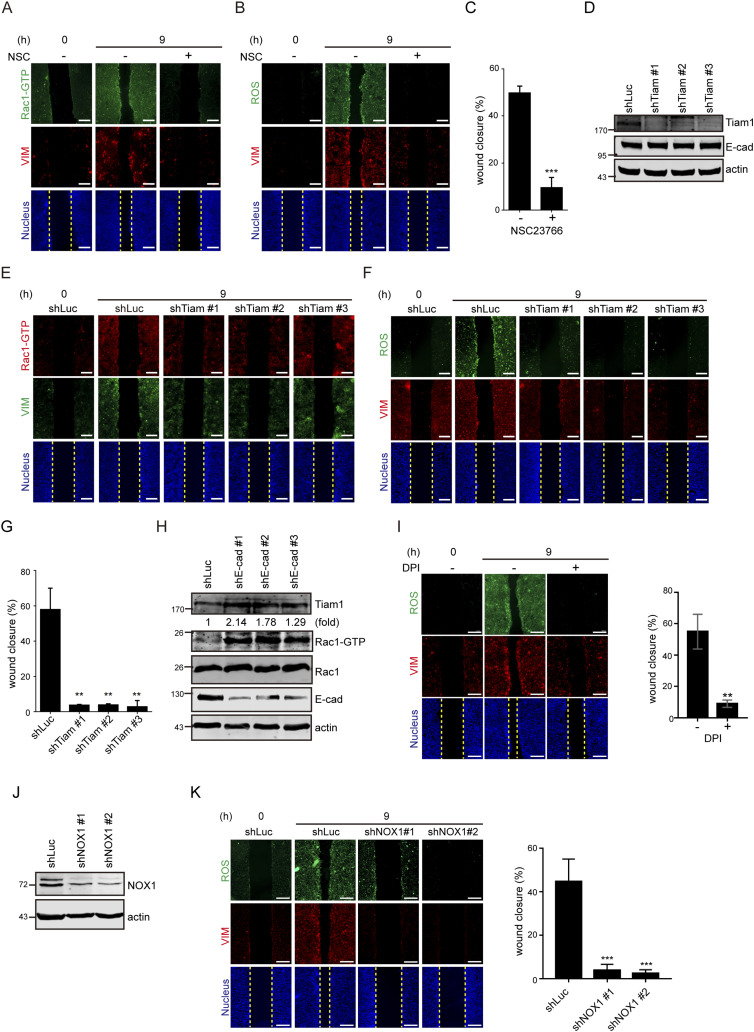
Loss of cell–cell adhesion generates ROS through Tiam1-mediated Rac1 activation.
(A) SAS cells were grown into a monolayer, and a cell-free gap (i.e., wound) of ∼500 µm in width was created. The wound healing assay was performed in the presence (+) or absence (−) of 10 µM NSC23766 (Rac1 inhibitor) for 9 h. The cells were stained for GTP-bound Rac1 (Rac-GTP), vimentin, and nucleus. Representative images taken at 0 and 9 h are shown. Scale bars, 250 µm. …..(D) SAS cells were infected with lentiviruses expressing shRNAs to Tiam1 (shTiam1) or luciferase (shLuc) as the control. Three shRNA target sequences to Tiam1 (shTiam1 #1, #2, and #3) were used. An equal amount of whole-cell lysates was analyzed by immunoblotting with the antibodies as indicated. (D, E) Cells as described in (D) were subjected to the wound healing assay. 9 h later, the cells were stained for Rac-GTP, vimentin, and nucleus. Representative images taken at 0 and 9 h are shown. Scale bars, 250 µm. (D, F) Cells as described in (D) were subjected to the wound healing assay. 9 h later, the cells were stained for ROS, vimentin, and nucleus. Representative images taken at 0 and 9 h are shown. Scale bars, 250 µm. (D, G) Cells as described in (D) were subjected to the wound healing assay for 9 h. The width of the cell-free gap was measured and expressed as a percentage of wound closure. Values (mean ± SD) are from three independent experiments. **P < 0.01. (H) SAS cells infected with lentiviruses expressing shRNAs to E-cadherin (shE-cad #1, #2, and #3) or luciferase (shLuc) were lysed, and an equal amount of whole-cell lysates was analyzed by immunoblotting with the antibodies as indicated. The expression level of Tiam1 was quantified and expressed as –fold relative to the shLuc control. ….
Immunofluorescence
All cells were fixed with 4% paraformaldehyde for 1 h, followed by permeabilization with 1% Triton X-100 for 30 min. Cells were then washed with 1× PBS and blocked with 2% bovine serum albumin in PBS and 1% Tween 20. Primary and secondary antibodies were diluted in block at 1:100 and 1:800, respectively, and incubated for 1 h at room temperature or overnight at 4°C. Cells were then stained with 2 µg/ml 4′,6-diamidino-2-phenylindole (DAPI; Life Technologies Cat #62248) solution for 15 min. Cells were then visualized using an EVOS microscope. and the cells that stained positive were counted and plotted as a bar graph. Primary antibodies: Most the same as for Western blots (above), others: cyclin D2 (Cat #NBP2-14460-25 ul), phalloidin ( Cat #R415), vinculin ( Cat #66305-1-1g), Rac-GTP (NewEast Biosciences Cat #26903), EdU (and PCNA) ( Cat #sc-56). Secondary antibodies: donkey anti-mouse Alexa Fluor 647 nm ( Cat ab150107), donkey anti-rabbit Alexa Fluor 594 nm (Abcam Cat #ab150076) and donkey anti-goat Alexa Fluor 488 nm (Abcam Cat #ab150129).
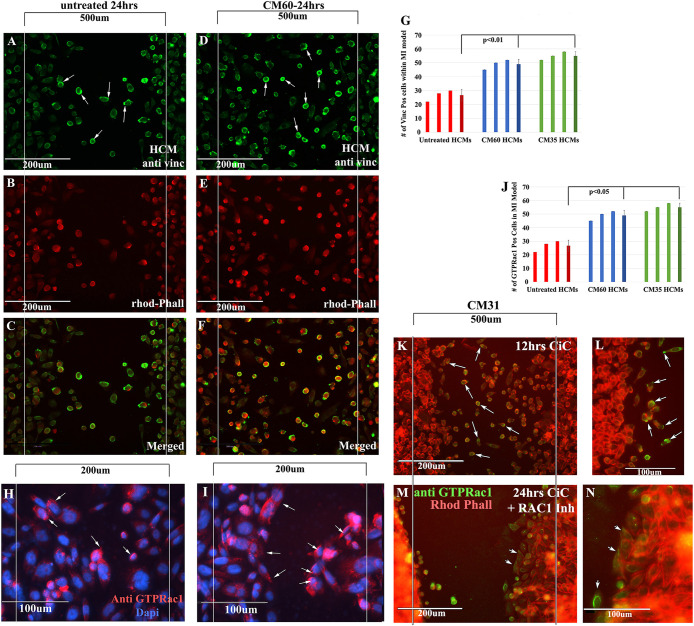
Equal amounts of HCMs were plated in ibidi inserts placed in wells of a 24-well dish. After removal of ibidi inserts, wells were treated with two different CiC-CM (CM #60 and CM #35) for 24 h. Consequently, treated and untreated wells were fixed and stained for antibodies against rhodamine phalloidin (red) and vinculin (green). (A) Vinculin staining of untreated HCMs. (B) Rhodamine-phalloidin staining of untreated HCMs. (C) Merged (vinculin/rhodamine) staining of untreated HCMs. Fewer rhodamine/vinculin (+) HCMs migrated in the 500 µm area in A–C. (D) Vinculin staining of CiC-CM (CM #60)-treated HCMs. (E) Rhodamine-phalloidin staining of CiC-CM (CM #60)-treated HCMs. (F) Merged staining of CiC-CM (CM #60)-treated HCMs. Increased vinculin/rhodamine staining on the leading edges of HCMs that migrated into the 500 µm area compared with untreated HCMs. (G) Vinculin (+) HCMs found in the 500 µm area were counted in all three treatments, plotted as a bar graph, and averaged. Statistical analyses showed that there was a significant increase in migration of vinculin (+) HCMs in both CiC-CM treatments compared with untreated. (H, I) CiC-CM–treated HCMs were stained with an antibody against Rac1 GTP. Several HCMs migrating deeper into the myocardial wound model (200 µm) expressed Rac1 GTP on the leading edges (arrowheads). (J) GTP Rac1–positive HCMs were counted in the 200 µm area in untreated, CiC-CM (CM 31 YO)-, and CiC-CM (CM 60 YO)-treated samples, plotted as a bar graph, and averaged. Statistical analyses showed that there was a significant increase in GTP Rac1(+) HCMs in both CiC-CM treatments compared with untreated. (K–N) Low (K) and high (L) magnification of HCMs show Rac1-GTP staining (green) cells primarily moving into the wound after only 12 h of CiC-CM treatment. Arrows point to leading/trailing edges of cells. (M, N) Low and high magnification of HCMs treated with CiC-CM and the Rac1 inhibitor 50 µM NCS23766. Few cells move into the wound even after 24 h of CiC-CM treatment. N = 3 for the experiment represented in this figure.
4.3 Immunohistology
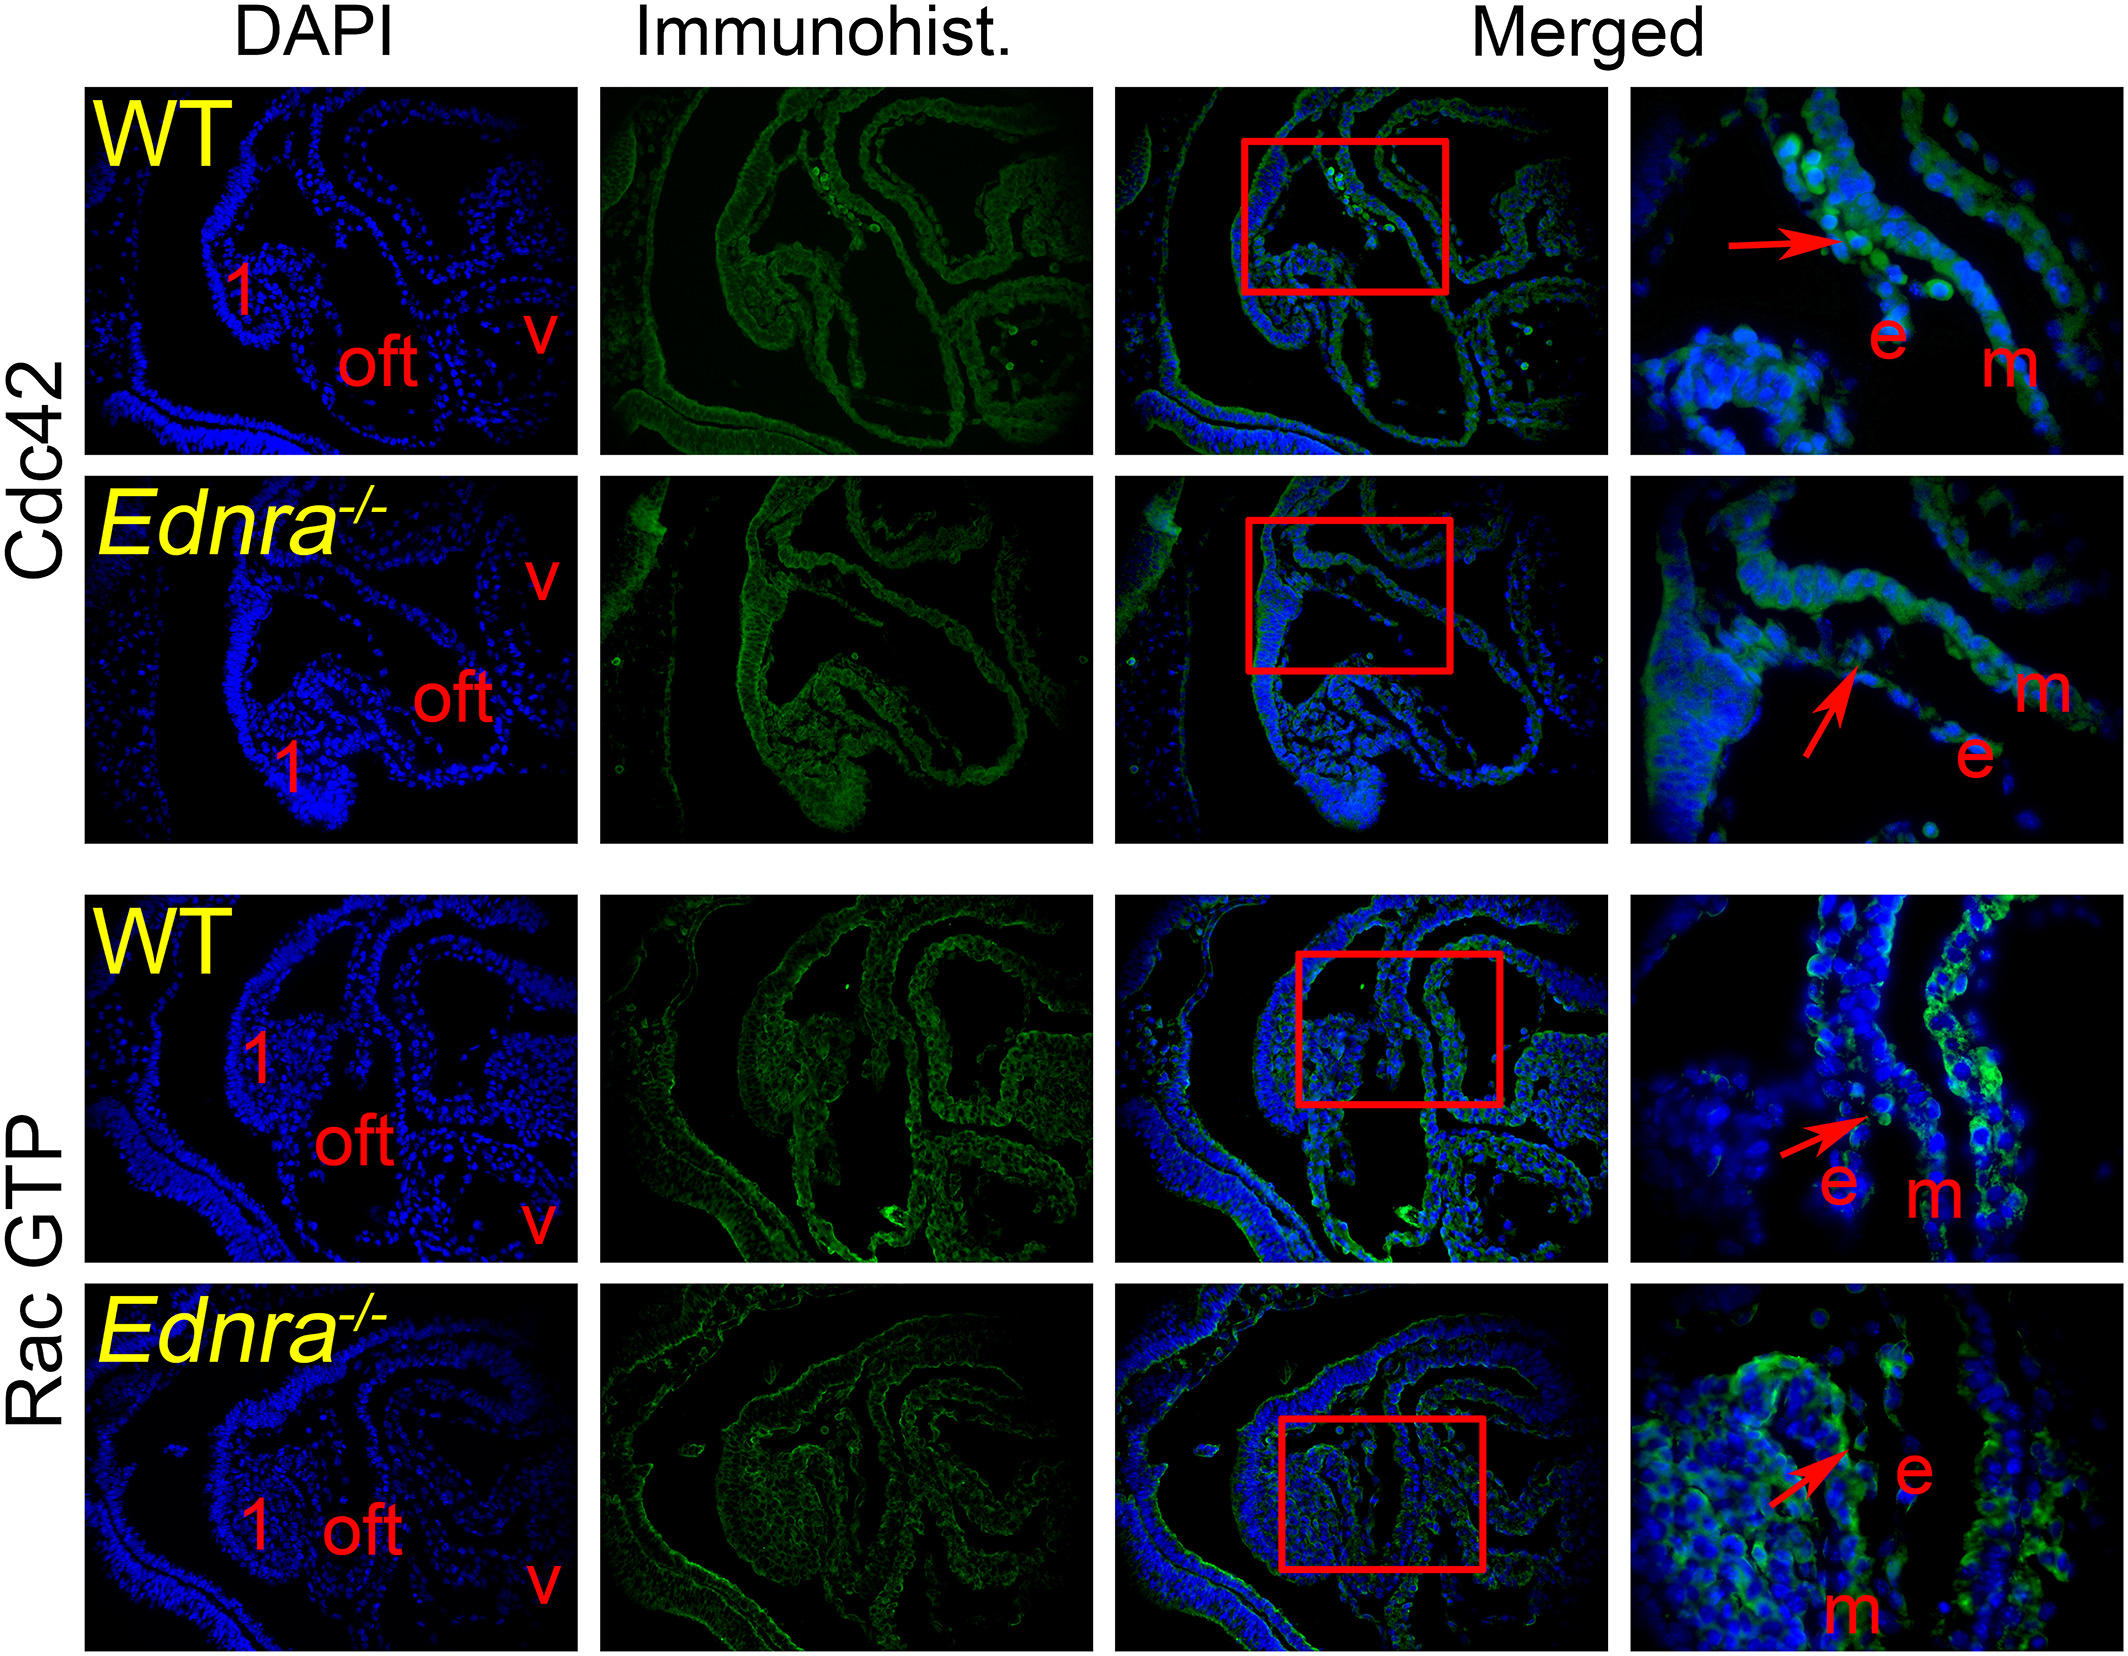
For the immunohistological assays, E9.5 Ednra −/− embryos were fixed in 4% paraformaldehyde/PBS, dehydrated in graded ethanols, embedded in paraffin and sectioned at 8 μm along the sagittal plane. After removing paraffin and rehydration, the sections were treated either with citric acid or Vector Lab’s high pH Antigen Unmasking solution at 90°C for 20 minutes to unmask the antigens. After blocking, the sections were incubated with primary antibodies diluted in PBS overnight at 4°C. The next day, the sections were rinsed and incubated with Alexa fluor-coupled secondary antibodies (Invitrogen). The rinsed slides were mounted with Slowfade Gold containing DAPI (Invitrogen) to counterstain the nuclei and then examined with a Leica TCS SP5 II confocal microscope. The following antibodies were obtained from Cell Signaling: β-actin (13E5), EGF receptor (D38B1), Erb2 (29D8), phospho-p44/42 Erk1/2 (D13.14.4E), phospho-paxillin (Tyr118), phospho-SAPK/JNK (81E11), p115 RhoGEF (D25D2), and phospho-Smad1/5 (41D10). The following antibodies were purchased from Santa Cruz Biotechnology: ACK (C-20), β-actin (C41), αPAK (C-19), phospho-αPAK (Thr212), βix/Cool1 (231), and WASP (B-9). The antibodies for collagen 1 (ab6308) and Cdc42 (ab155940) were obtained from Abcam, the active RacGTP antibody (26903) was purchased from NewEast Biosciences, and Epitomics was the provider of the Rho antibody (EP787Y). Antibodies were used according to providers’ recommendations. Immunostainings were repeated at least three times on sections from different embryos.
Cdc42 fails to localize properly in the CNCC of Ednra −/− embryos. Sagittal sections through the cardiac region of E9.5 wild-type (WT) and Ednra −/− embryos were counterstained with DAPI to reveal the nuclei. We examine the presence and localization of the small GTP binding proteins Cdc42 and Rac1 and 2 (activated form, Rac GTP) in the CNCC (red arrows in the enlarged view from preceding photograph) migrating in the outflow tract (oft). No differences were observed for the localization of the Rac GTP proteins. However in the mutant embryos, Cdc42 fails to localize at the edges of migrating CNCC, as revealed in the enlarged merged images. The enlarged area is framed by a red box. 1, pharyngeal (mandibular) arch 1; e, endomysium; m, myomysium; v, ventricle